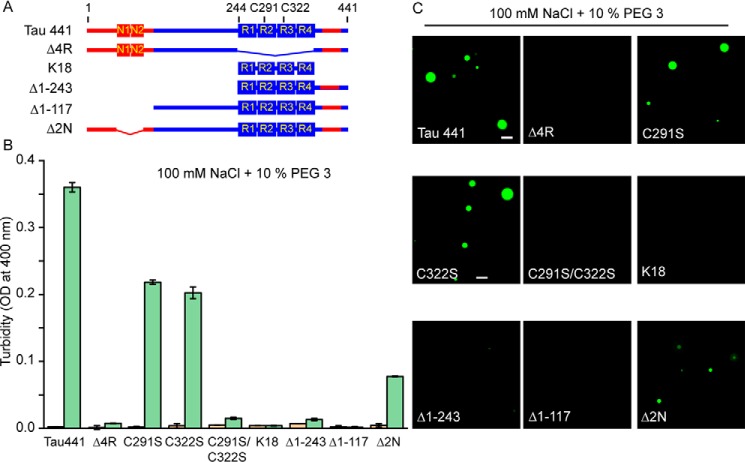
Figure 4.
The role of individual regions of tau and Cys residues in zinc-induced LLPS. A, schematic diagram of tau deletion/truncation variants used in this study. The basic and acidic regions are marked in blue and red, respectively. B, turbidity (OD at 400 nm) of different tau variants (10 μm each in a buffer containing 100 mm NaCl and 10% PEG 3) in the absence (orange) and presence (green) of 40 μm Zn2+. Error bars, S.D. (n = 5). C, representative fluorescence microscopy images of different tau variants (10 μm each) in the presence of 40 μm Zn2+. The images were recorded in a buffer containing 100 mm NaCl and 10% PEG 3. Scale bar, 5 μm.

