Figure 3.
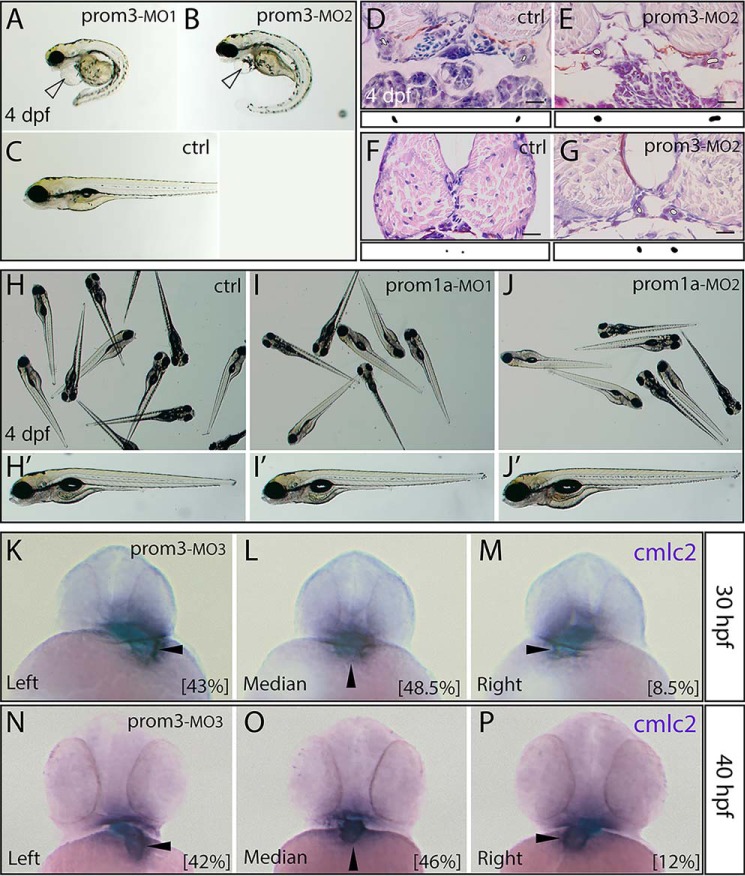
Morphological phenotypes upon prom3 knockdown. A–P, embryos were injected at the one-cell stage with distinct MO against either prom3 (A, MO1, 5 ng; B, E, and G, MO2, 10 ng; K–P, MO3, 10 ng) or prom1a (I and I′, MO1, 10 ng; J and J′, MO2, 10 ng) or with control MO (C, D, F, H, and H′, ctrl, 10 ng). At different developmental stages as indicated, specimens were either observed in a native, unfixed state (A–C and H–J), analyzed histologically with hematoxylin and eosin staining (D–G), or processed for whole-mount ISH using antisense DIG-labeled probe against cmlc2 (K–P). At early (K–M; 30 hpf) and late (N–P; 40 hpf) pharyngula periods, a randomized position (left, median, or right) of the heart tube highlighted by cmlc2 (arrowhead) is observed in prom3 morphants. Numbers in parentheses indicate the frequencies of phenotypes (30 hpf, n = 35; 40 hpf, n = 59). At 4 dpf, prom3 morphants, but neither the control nor prom1a MO-injected ones (C and H–J′), displayed severe morphological disturbances including swollen pericardium (A and B; hollow arrowhead), ventrally curved body (A and B), and an increased lumen size of the pronephric duct (E and G; outlined white surface). The surface areas of the lumen size are depicted as black blobs under the corresponding image. Orientation is as follows. A–C and H′–J′, lateral; H–J, random; K–P, anterior (dorsal toward top). Scale bars (D–G), 16 μm.

