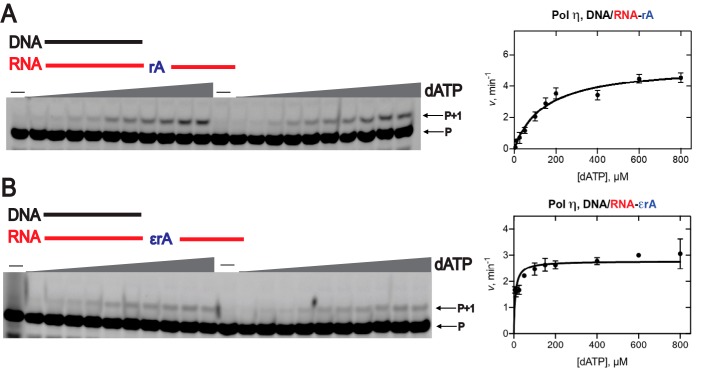
Figure 6.
Steady-state kinetic analysis of dATP insertion by hpol η during reverse transcription. PAGE (20%, 7 m urea) of steady-state kinetic analysis using hpol η (2–2.5 nm) was conducted with varying concentrations of dATP (0–800 μm, indicated with wedges). A, DNA/RNA-rA; B, DNA/RNA-1,N6-ϵrA. All reactions were carried out at 37 °C for 5 min in duplicate. The indicated data points are shown as means ± S.D. (error bars); see Table 1 for kcat and Km values (estimated using fits to a hyperbolic equation in Prism (GraphPad)); see “Experimental procedures” and Table S1 for the oligonucleotide sequences. P, FAM-labeled DNA primer.

