Figure 4.

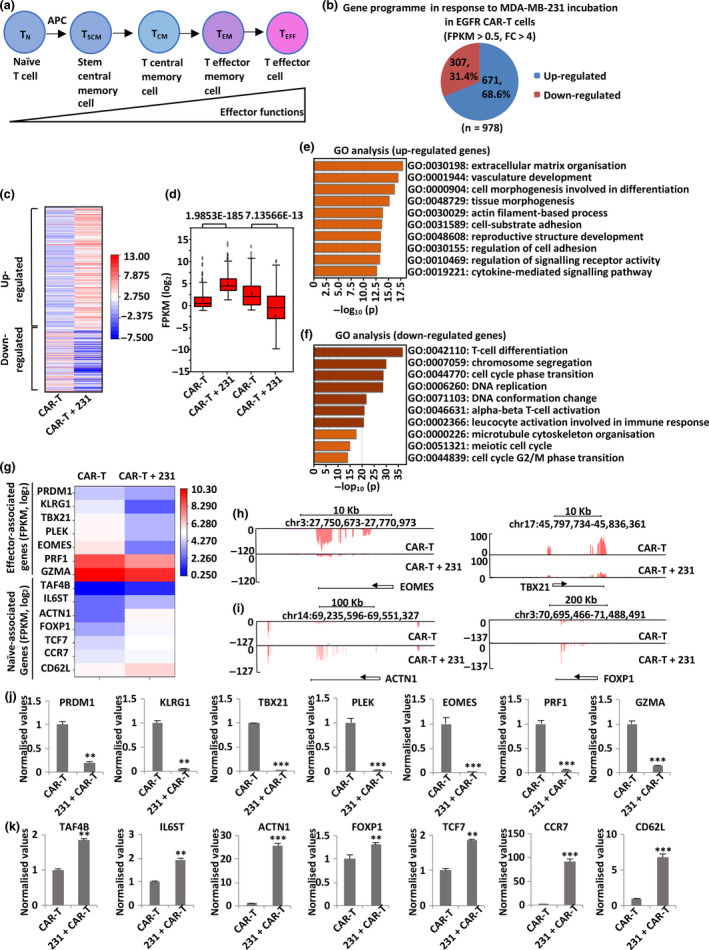
TNBC‐stimulated EGFR CAR‐T cells exhibit an induced naïve‐associated gene signature. (a) Schematic representation of CD8+ T‐cell differentiation. (b) EGFR CAR‐T cells were incubated with or without MDA‐MB‐231 cells (at a ratio of 1:2) for 3 days, and CAR‐T cells in suspension were separated from adherent tumor cells and collected, followed by RNA extraction and RNA sequencing (RNA‐seq) analysis. Up‐ and down‐regulated genes of CAR‐T cells upon incubation with MDA‐MB‐231 cells (FPKM > 0.5, FC > 4) are shown in the pie chart. RNA from three biological replicates was pooled for RNA‐seq. (c, d) Heat map (c) and box plot (d) representation of the expression levels (FPKM, log2) of the up‐ and down‐regulated genes described in b. P‐values are shown at the top (d). (e, f) GO analysis of the up‐ (e) and down‐regulated (f) genes described in b. (g) The expression (FPKM, log2) of representative genes associated with effector and naïve T‐cell function in EGFR CAR‐T cells in response to MDA‐MB‐231 cell co‐incubation as detected by RNA‐seq is shown in the heat map. (h, i) UCSC Genome Browser views of representative genes associated with effector (h) and naïve (i) T‐cell function from RNA‐seq analysis. (j, k) Cells described in b were subjected to RNA extraction and quantitative reverse transcription polymerase chain reaction (RT‐qPCR) analysis to examine the expression of representative genes associated with effector (j) and naïve (k) T‐cell function in EGFR CAR‐T cells. Data were obtained from three replicates and are presented as mean ± s.e.m. (**P < 0.01, ***P < 0.001). 231, MDA‐MB‐231; APC, antigen‐presenting cells; CAR‐T, chimeric antigen receptor‐modified T cells; chr, chromosome; EGFR, epidermal growth factor receptor; FC, fold change; FPKM, fragments per kilobase per million; GO, gene ontology; TCM, central memory T cells; TEFF, effector T cells; TEM, effector memory T cells; TN, naïve T cells; TSCM, T stem central memory cells.
