Figure 6.

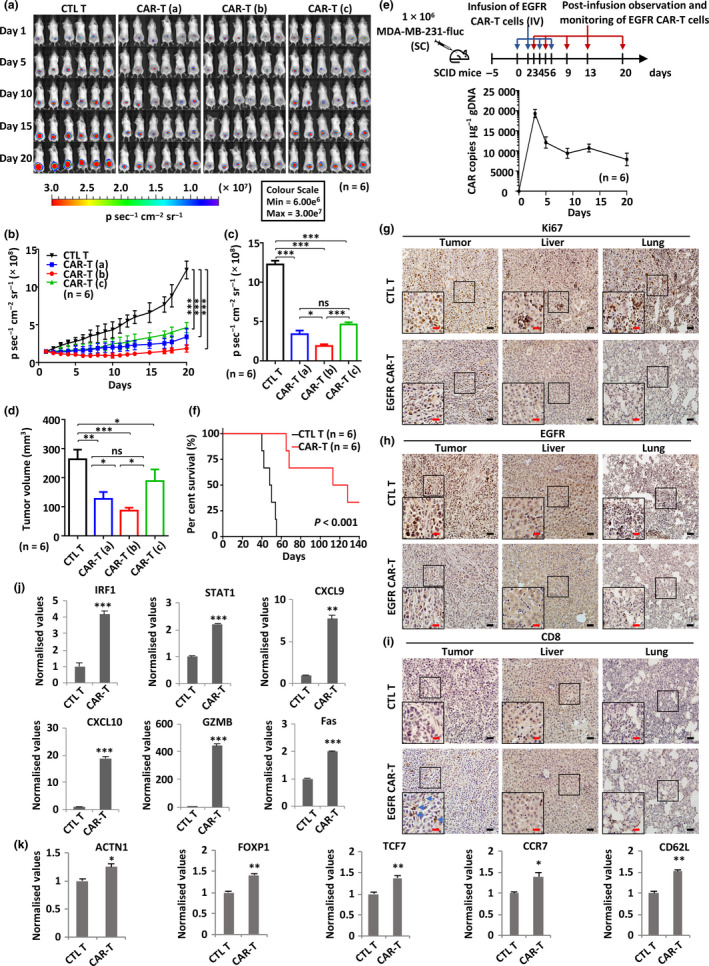
EGFR CAR‐T cells exhibit potent and specific antitumor activities in TNBC xenograft mouse model. (a) SCID mice were injected subcutaneously with MDA‐MB‐231 cells (1.0 × 10⁶) stably expressing a luciferase reporter (MDA‐MB‐231‐fluc). Five days after tumor inoculation, mice were treated intravenously with CTL T or three different dosages of EGFR CAR‐T cells (CAR‐T (a), 2.5 × 10⁶ cells per injection; CAR‐T (b), 5.0 × 10⁶ cells per injection; CAR‐T (c), 1.0 × 10⁷ cells per injection) every other day (n = 6). The day mice received CAR‐T treatment was considered as day 1. Tumor growth was monitored by using bioluminescence imaging for 20 days. Representative data of two independent experiments are shown. (b) Tumor growth curve based on bioluminescence as described in a. Data are presented as mean ± s.e.m.. Statistical significance across multiple comparisons was determined using two‐way ANOVA (***P < 0.001). (c, d) Average bioluminescence (c) and average tumor volume (d) after 20 days of observation as described in a. . Data are presented as mean ± s.e.m. (*P < 0.05, **P < 0.01, ***P < 0.001). (e) gDNA extracted from peripheral blood mononuclear cells (PBMCs) of recipient mice (n = 6) at different time points after injection of EGFR CAR‐T cells was subjected to RT‐qPCR analysis to measure CAR gene copy. The timeline of EGFR CAR‐T injection and blood collection is depicted at the top. Data are presented as mean ± s.e.m.. (f) Survival analysis of mice upon CTL T or EGFR CAR‐T treatment (5 × 10⁶ cells per injection, n = 6). The experiment was terminated at day 140. Representative data of two independent experiments are shown. P‐value was determined using the log‐rank (Mantel–Cox) test. (g–i) Primary tumor, liver and lung sections from CTL T‐ or EGFR CAR‐T‐treated mice (5 × 10⁶ cells per injection) described in a were subjected to IHC staining by anti‐Ki67 (g)‐, EGFR (h)‐ and CD8 (i)‐specific antibodies. Diaminobenzidine (DAB) staining was used for further chromogenic detection (brown). Blue arrows indicate CD8+ staining in i. Representative images are shown. Representative regions are enlarged from 200× (small‐sized black square) to 400× magnification (big‐sized black square) for clarity. Scale bars, 50 µm (black line) and 25 µm (red line). Representative data of three independent experiments are shown. (j, k) Primary tumor tissues from CTL T‐ or EGFR CAR‐T‐treated mice (5 × 10⁶ cells per injection) described in a were subjected to RNA extraction and RT‐qPCR analysis to examine the expression of the indicated IFNγ target genes (j) and T‐cell genes (k). Data were obtained from three replicates and are presented as mean ± s.e.m. (*P < 0.05, **P < 0.01, ***P < 0.001). CAR‐T, chimeric antigen receptor‐modified T cells; CTL T, control T cells; EGFR, epidermal growth factor receptor; gDNA, genomic DNA; IV, intravenous injection; ns, non‐significant; SC, subcutaneous injection; SCID, severe combined immunodeficient.
