
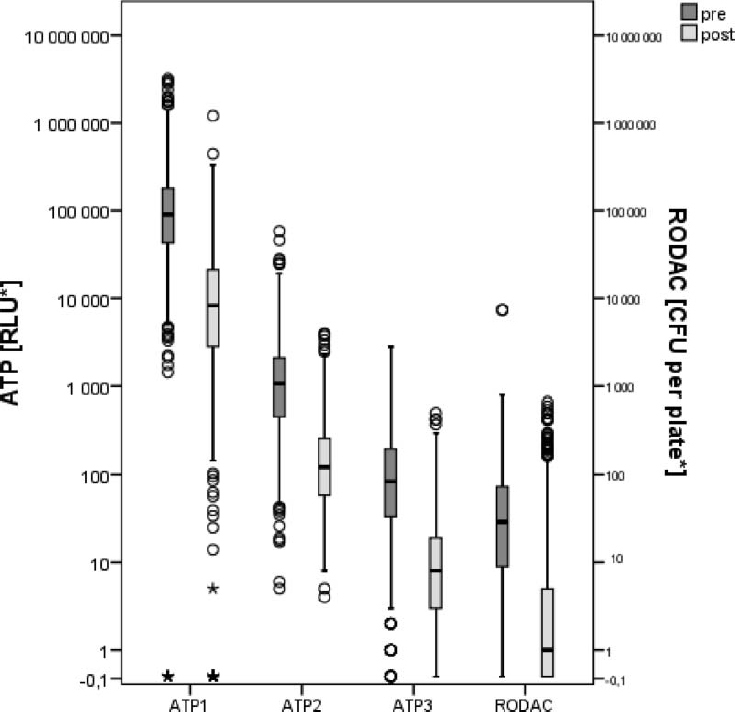
FIGURE 1. Box plots for collective all surfaces pre- and post-cleaning results for ATP and RODAC data. Note:
 ATP and RODAC values are each sampled for 25 cm2 surface area.
Official websites use .gov
A
.gov website belongs to an official
government organization in the United States.
Secure .gov websites use HTTPS
A lock (
) or https:// means you've safely
connected to the .gov website. Share sensitive
information only on official, secure websites.
ATP and RODAC values are each sampled for 25 cm2 surface area.