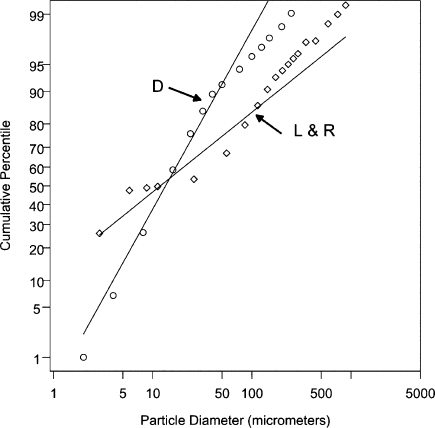
FIGURE 1. Log-probability plots of particle diameter (μm) versus cumulative percentile by count. The circles show Duguid's cough data, where the diameters are the initial particle diameters. The line labeled “D” shows the expected cumulative percentiles for Duguid's data given a fitted two-parameter lognormal distribution with estimated parameters of GM = 14 μm and GSD = 2.6. The diamonds show the Louden and Roberts cough data, where the diameters are the equilibrium particle diameters. The line labeled “L&R” shows the expected cumulative percentiles for the Louden and Roberts data given a fitted two-parameter lognormal distribution with estimated parameters of GM = 12 μm and GSD = 8.4.

