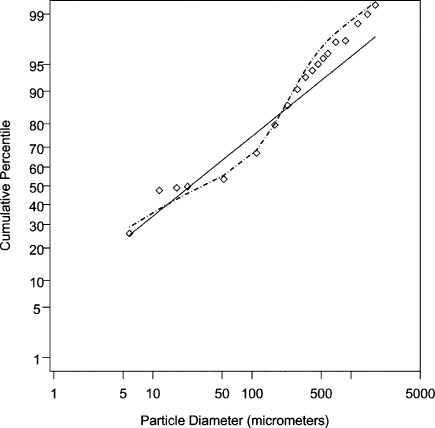
FIGURE 2. Log-probability plots of particle diameter (μm) versus cumulative percentile by count for the adjusted Louden and Roberts cough data, where the diameters are the presumed initial particle diameters (2× the reported values). The diamonds show the observed cumulative percentiles. The solid line shows the expected cumulative percentiles given a fitted two-parameter lognormal distribution model for the data with the estimates GM = 24 μm and GSD = 8.4. The dashed curved line shows the expected cumulative percentiles given a fitted mixture model of two lognormal distributions for the data. There is a distribution of “small” particles with estimates GM = 9.8 μm and GSD = 9.0, and a distribution of “large” particles with estimates GM = 160 μm and GSD = 1.7. The small particle distribution contains 71% of all the cough particles, and the large particle distribution contains 29%.

