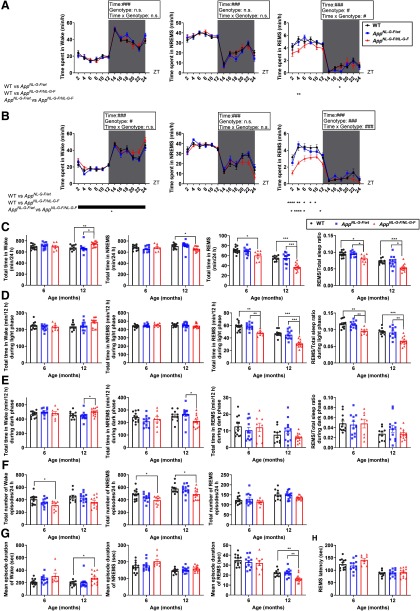
Figure 2.
AppNL-G-F/NL-G-F mice exhibit age-dependent impairments in sleep architecture. A, B, Diurnal sleep-wake cycles of six-month-old (A) and 12-month-old (B) mice. Each point represents the mean ± SEM; #p < 0.05, ###p < 0.001, mixed ANOVA; *p < 0.05, **p < 0.01, ***p < 0.001, ****p < 0.0001, post hoc Games–Howell multiple comparison test. C–E, Total amount of wake, NREMS, REMS, and ratio of REMS to total sleep [24 h (C), light period (D), and dark period (E)]. F, G, Number of episodes (F) and mean episode duration (G) in each stage of wake, NREMS, and REMS. H, REMS latency. Bar graphs represent the mean ± SEM. Each point represents an individual mouse; *p < 0.05, **p < 0.01, ***p < 0.001, Games–Howell multiple comparison test. Detailed results of the statistical tests are described in Extended Data Figure 2-1.

