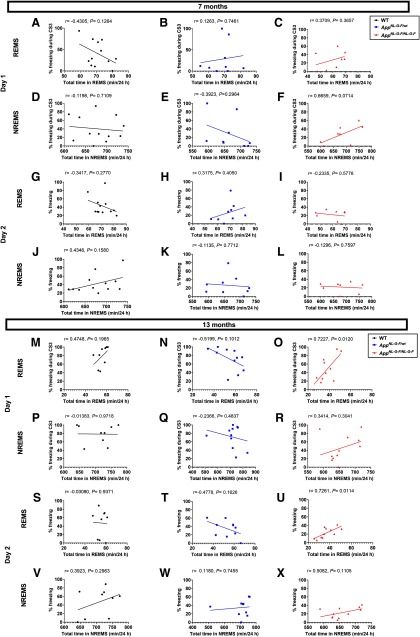
Figure 6.
Correlations between the amount of time spent in each sleep stage and the performance in trace FC. A–L, Correlation between the total amount of REMS or NREMS and the percent time spent freezing either during the third CS on day 1 (training) or during CS on day 2 (retrieval) in WT, AppNL-G-F/wt and AppNL-G-F/NL-G-F mice of the younger age. M–X, Correlation between the total amount of REMS or NREMS and the percent time spent freezing either during the third CS on day 1 (training) or during CS on day 2 (retrieval) in WT, AppNL-G-F/wt and AppNL-G-F/NL-G-F mice of the older age. Each point represents an individual mouse. The line in each graph represents the regression line. Pearson’s correlation coefficient (r) and p value are provided.

