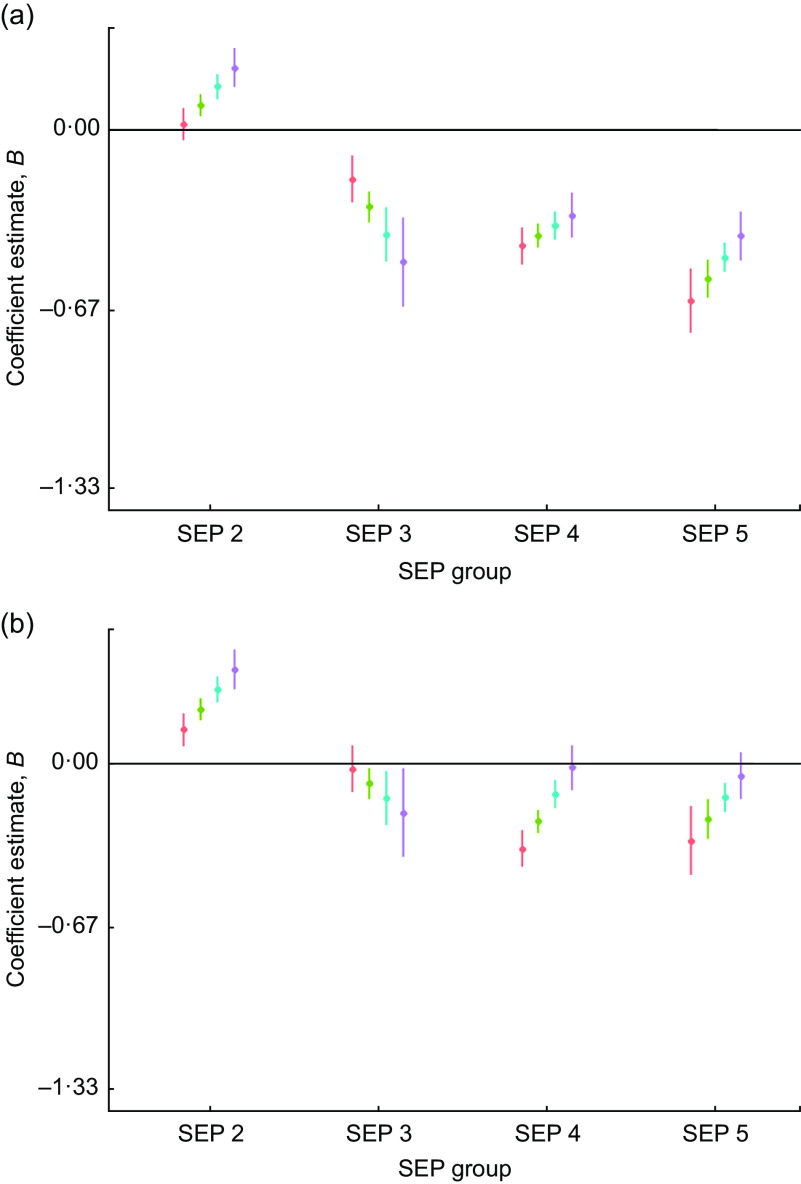
Fig. 4.
Regression estimates of (a) male and (b) female BMI size Z-scores (dots) with 95 % CI (whiskers) across socio-economic position (SEP) groups (2–5), with SEP 1 as reference group (horizontal line at 0), by decade of birth centred on 1960 ( ), 1970 (
 ), 1980 (
 ) and 1990 (
 ), for children and adolescents (n 40 484) aged 3–19 years of Ladino and Maya ancestry born during 1955–1993 in Guatemala (n
observations 157 067). The plots were created using R packages ggplot2, broom, jtools, dotwhisker and dplyr (see the online supplementary material for references)

