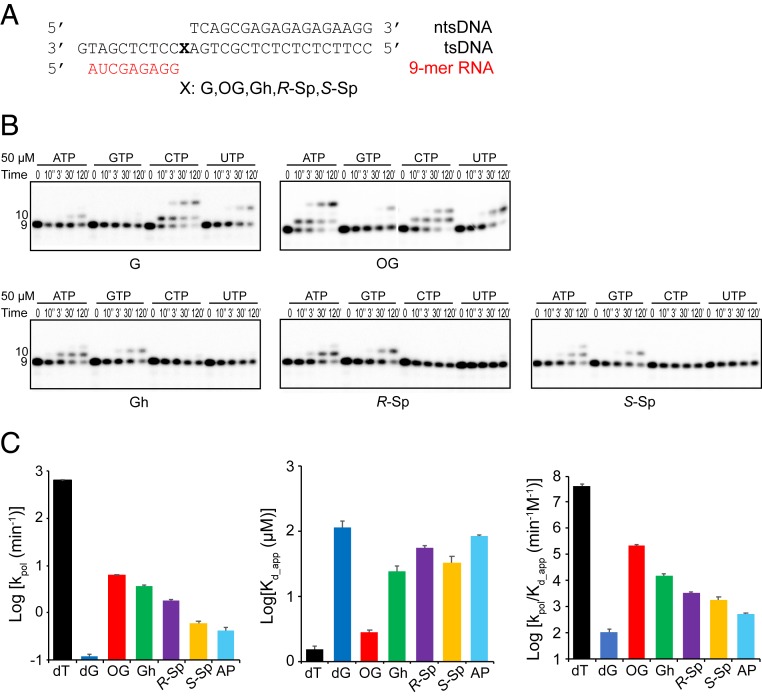
Fig. 3.
Impact of consecutive oxidation products of guanine on substrate selectivity and ATP incorporation kinetics. (A) The sequences of the transcription scaffold containing site-specific lesions. X represents G, 8OG, Gh, R-Sp, or S-Sp, respectively. The color code is the same as in Fig. 1B. (B) Single nucleotide incorporation assay. Pol II EC with Gh, R-Sp, or S-Sp prefers A and G incorporation (purines), whereas 8OG preferentially incorporates both A and C. A total of 50 μM of each rNTP was used as final concentration. The time points are 0, 10 s, 3 min, 30 min, and 2 h. (C) Kinetic parameters of ATP incorporation opposite each lesion. We compared rate constants (kpol), apparent substrate binding affinity (Kd.,app), and overall catalytic efficiency (Log kpol/Kd,app). The color codes for parameters are: black (dT), blue (dG), red (OG), green (Gh), purple (R-Sp), yellow (S-Sp), and cyan (abasic site [AP]). Raw gel data are shown in SI Appendix, Fig. S3. All data were processed by using Prism. Error bars indicate SE calculated from regression fit. Kinetic parameters of dT and abasic site are referred to from our previous paper (30). Numerical values are indicated in SI Appendix, Table S1.

