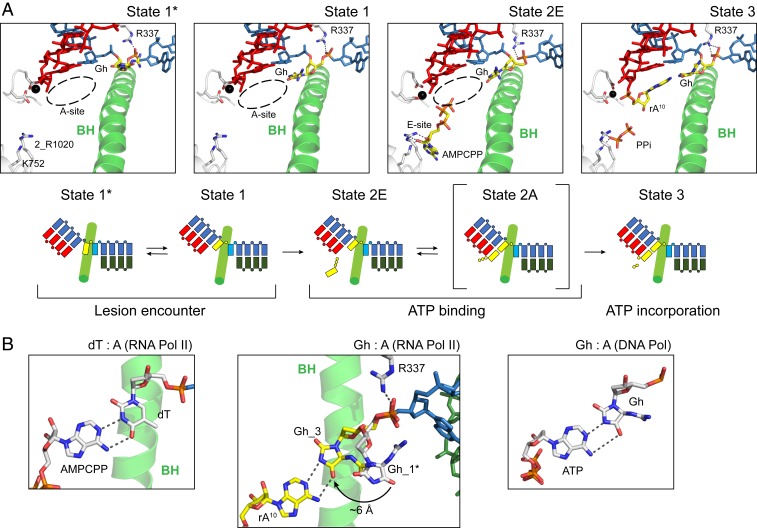
Fig. 7.
Structural basis of ATP binding and incorporation opposite the Gh lesion. (A) The overview structures of the Pol II EC active site at four different snapshots of ATP binding and incorporation (states 1*, 1, 2E, and 3). The Gh template and incoming ATP are colored in yellow. Mg2+ ion is represented as a black sphere. Residues that interact with nucleotide substrate or metal are indicated. Dashed circle indicates the A-site. Schematic representations of each state are shown at Bottom. Rpb2 R1020 is labeled as 2_R1020. All other labeled Pol II residues are from Rpb1 subunit. (B) Comparison of base pairing between dT: A or Gh: A in RNA pol II, and Gh: A in DNA polymerase (PDBs: 4A3L and 3NAE). The Gh base from state 3 and rA10 is colored in yellow, while other bases are colored in white. Dashed line indicates potential hydrogen bonding distance. Black arrow indicates movement of the hydantoin ring of the Gh lesion upon ATP binding.

