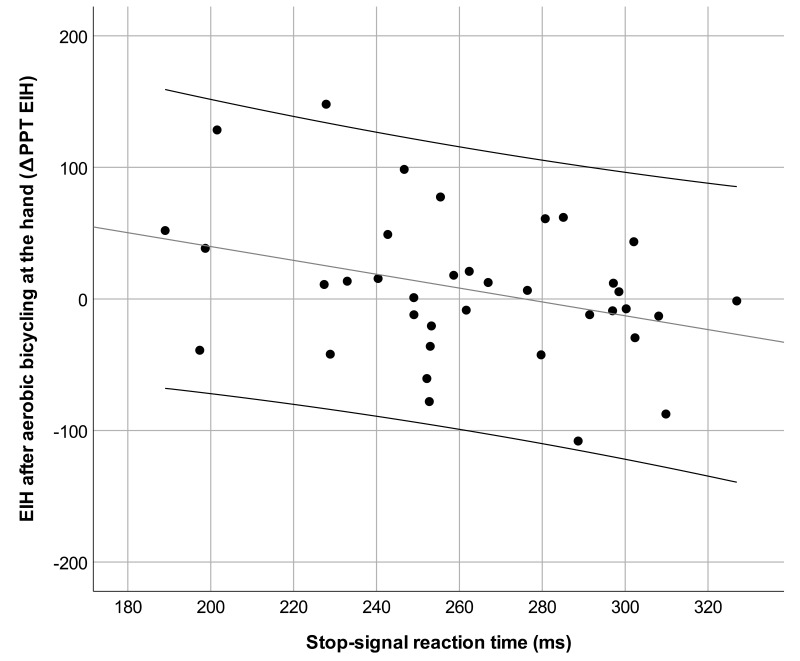
Figure 2.
Scatterplot of ∆PPT after aerobic bicycling exercise at the hand and stop-signal reaction times, depicting a moderate negative correlation of (r = −0.35, 95% CI: −0.57; −0.08, p = 0.021). Note that shorter stop-signal reaction times represent better cognitive inhibition. Scatterplots for all other correlations are displayed in Figures S1–S7.

