Fig. 4.
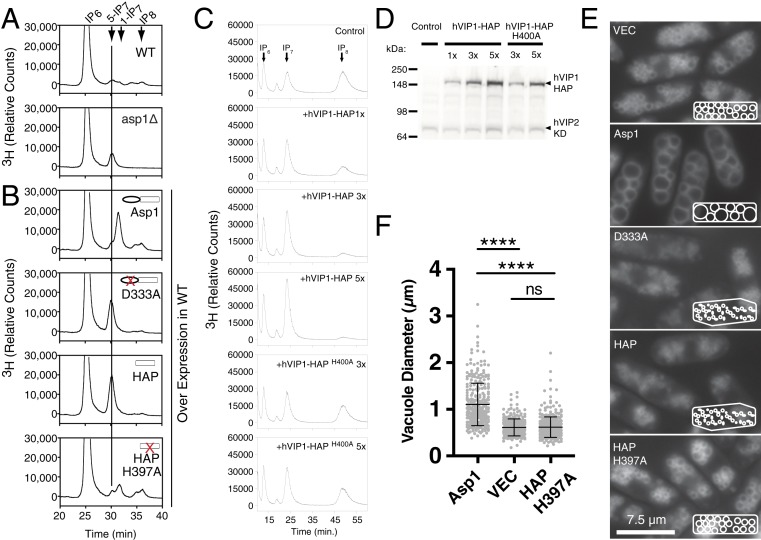
In vivo analysis of inositide metabolism and vacuolar morphology in fission yeast and human cells. (A) Metabolic analysis of inositides from 3H-inositol–labeled WT and asp1-null (asp1Δ) fission yeast. (B) Inositide metabolism in radiolabeled fission yeast overexpressing Asp1 proteins. Increase in 1-IP7 and IP8 are observed when full-length Asp1 is overproduced (top trace). Loss of IP8 and increase 5-IP7 are observed in cells overexpressing Asp1 kinase-dead protein D333A mutant (second trace) or HAP domain along (third trace). No significant changes in IP7 or IP8 are observed in cells overproducing HAP pyrophosphatase dead H397A mutants (compare top trace in A to fourth trace in B). (C) Metabolic profiles of inositol pyrophosphates in human embryonic kidney HEK293 cells engineered to overproduce 1,5-IP8. Expression of human Vip1 pyrophosphatase domain (hVip1-HAP) but not catalytically dead mutant (hVip1-HAPH400A) results in decreased 1,5-IP8 levels. Transfections of 1×, 3×, and 5× reflect increased plasmid dosage during labeling. The isomer of IP7 observed is predominantly 5-IP7 which is the product of the 1,5-IP8 hydrolysis. For all metabolic labeling in A–C, experiments were performed using a minimum of three independent samples and representative HPLC traces are shown. y axis indicated relative counts (counts per minute) normalized to each sample’s total counts per minute (greater than 90% of which is derived from a peak that elutes at 5′ time corresponding to free 3H-inositol standard). (D) Western blot analysis of expression levels of human Vip1 pyrophosphatase domain (CFP-hVip1-HAP) and kinase domain (CFP-hVip2-KD). Transfections of 1×, 3×, and 5× reflect increased plasmid dosage during Western blotting. (E) Alterations in vacuolar morphology in osmotically shocked cells overexpressing Asp1 WT or kinase or pyrophosphatase dead proteins. Imaging in live cells induced to overexpress vector control (VEC), full-length (Asp1), full-length kinase-dead (D333A), Asp1 histidine acid pyrophosphate domain only (HAP), or HAP pyrophosphate dead (HAP-H397A). Cells were induced to overexpress proteins by removing thiamine for 30 h, osmotically shocked in H2O for 1 h, stained with vacuole specific dye FM4-64, and imaged. Cartoon Insets depict effect on cell shape, and vacuolar number/cell and diameter. (Scale bar, 7.5 μm.) (F) Vacuole diameter was quantified in fission yeast overexpressing Asp1 WT (n = 301), vector control (n = 267), or HAP pyrophosphatase dead HAP-H397A (n = 379) using Nikon Elements Analysis software. The quadruple asterisk indicates a value of P < 0.0001 as determined by ANOVA statistical analysis with Tukey’s multiple-comparison test.

