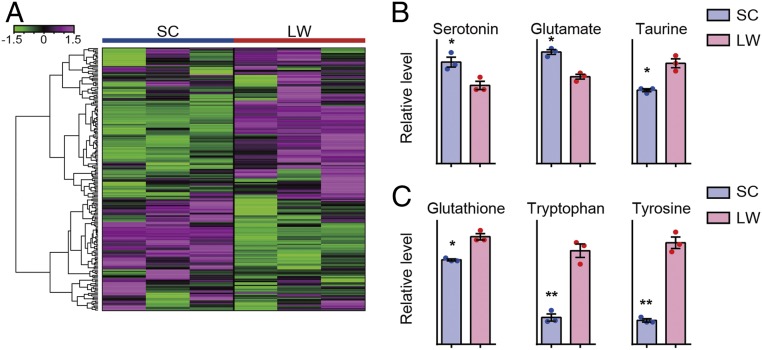
Fig. 2.
Brain metabolites reflect depression-like status in winter-like conditions. (A) Hierarchical clustering of 204 measured metabolites. The color scale at the left represents normalized signal intensity. (B) Metabolomic measurements of the neurotransmitters, serotonin, glutamate, and taurine. (Welch’s t test, *P < 0.05, mean ± SEM, and n = 3). (C) Metabolomic measurements of the antioxidant glutathione and the amino acids tryptophan and tyrosine (Welch’s t test, *P < 0.05, **P < 0.01, mean ± SEM, and n = 3).

