Fig. 3.
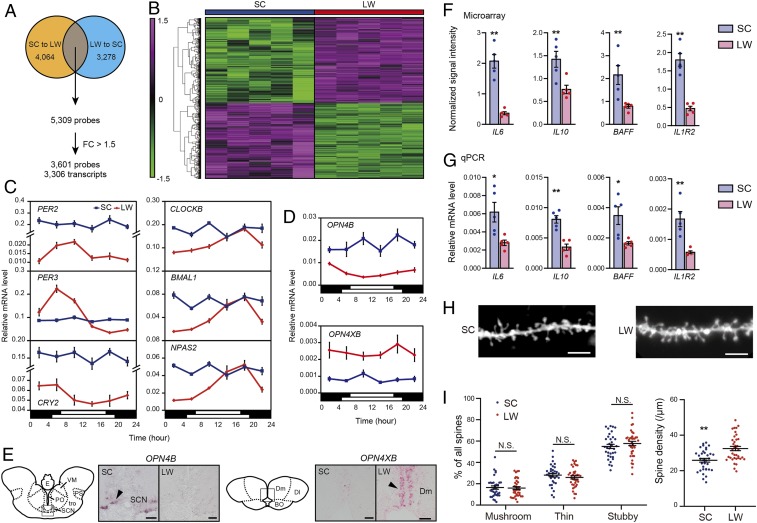
Disruption of circadian rhythms and elevation of inflammatory markers in winter-like conditions. (A) Two sets of microarray experiments identified 5,309 differential probes between SC and LW conditions. Further analysis using a fold-change (FC) cutoff of 1.5 identified 3,601 probes representing 3,306 transcripts. (B) Clustered organization of 3,601 probes between SC and LW conditions. Data were normalized over the entire data set. The color scale at the Left represents the normalized signal intensity. (C) Temporal expression profiles of circadian clock genes under SC (blue) and LW (red) conditions verified by qPCR. The bars at the bottom of each graph represent the lighting conditions (two-way ANOVA, P < 0.05, mean ± SEM, and n = 4 to 5). Note that for PER2 and CRY2, the y axis values are different for SC and LW conditions. (D and E) Seasonal changes in OPN4B and OPN4XB expressions validated by qPCR (D) and in situ hybridization (E). The black arrow indicates the hybridization signal. (Scale bar, 40 μm) (two-way ANOVA, P < 0.05, mean ± SEM, and n = 4 to 5). BO: bulbus olfactorius; Dl: pars lateralis of the dorsal telencephalic area; Dm: pars medialis of the dorsal telencephalic area; E: epiphysis; PO: nucleus preopticus; PS: nucleus pretectalis superficialis; SCN: suprachiasmatic nucleus; tro: tractus opticus; VM: nucleus ventromedialis thalami. (F and G) Seasonal changes in the cytokines and cytokine receptor measured by microarray (F) and qPCR (G) (Welch’s t test, *P < 0.05, **P < 0.01, mean ± SEM, and n = 5). (H) Representative images of DiI-labeled dendritic spines within the DI. (Scale bar, 5 μm.) (I) Spine morphology and density within the DI, analogous to the mammalian hippocampus, in SC and LW conditions (Welch’s t test, **P < 0.01, N.S. is not significant, mean ± SEM, and n = 34 and 37 dendritic segments analyzed for SC and LW conditions, respectively).

