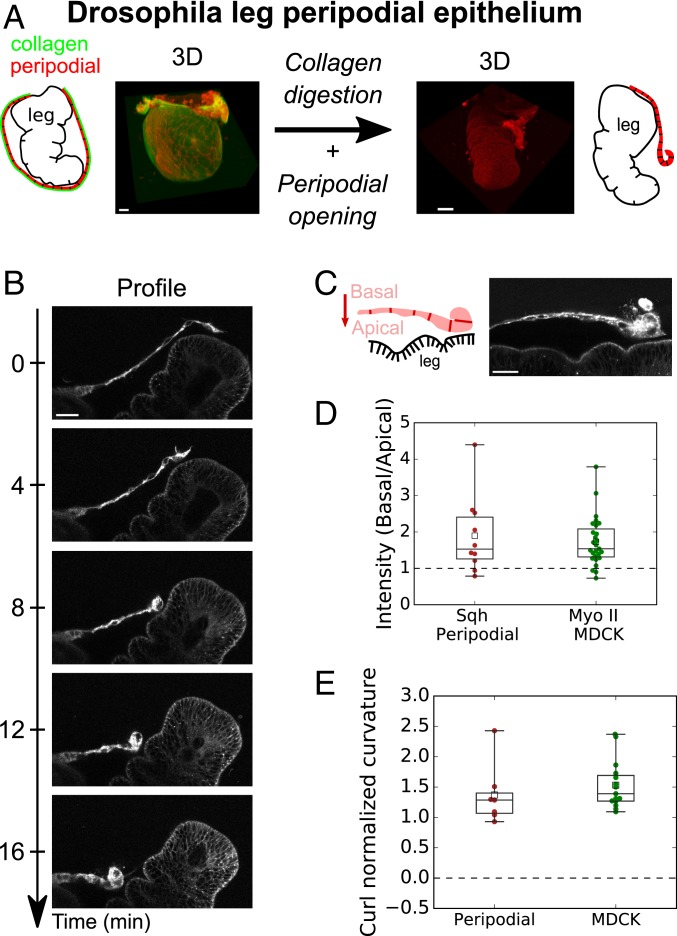
Fig. 2.
The peripodial epithelium curls in vivo during Drosophila leg disk eversion. (A) Fate of peripodial epithelium during Drosophila leg disk eversion. Before eversion (Left), the leg epithelium is encapsulated in the squamous peripodial epithelium whose basement membrane (Vkg-GFP; green) is intact. After collagen digestion, the peripodial epithelium ruptures and withdraws (Right) allowing leg eversion. Cell membranes are marked with CellMask (red). (Scale bars: 20 m.) (B) Time series of a retracting peripodial epithelium imaged with confocal microscopy. Profile view in the plane perpendicular to the retraction front. Cell membranes are marked with CellMask (red). (Scale bar: 20 m.) (C) Distribution of Sqh-RFP (Myosin II homolog) during Drosophila leg eversion. (Scale bar: 20 m.) (D) Ratio of average fluorescence intensity in the basal surface to the apical surface (see method in SI Appendix). Intensity of Sqh-RFP for the peripodial epithelium (n = 10) and Myosin II-GFP (pooled for Myosin II-A and II-B, n = 52 cells from nine monolayers) for MDCK suspended monolayers. Significance tests are one-sample t tests comparing the mean of the distribution to a value of 1 (SI Appendix, SI Methods). (E) Boxplot of normalized curvature (ratio of average tissue height over average radius of curvature ) at the monolayer free edge in the peripodial epithelium (n = 7) and in MDCK monolayers (n = 15).

