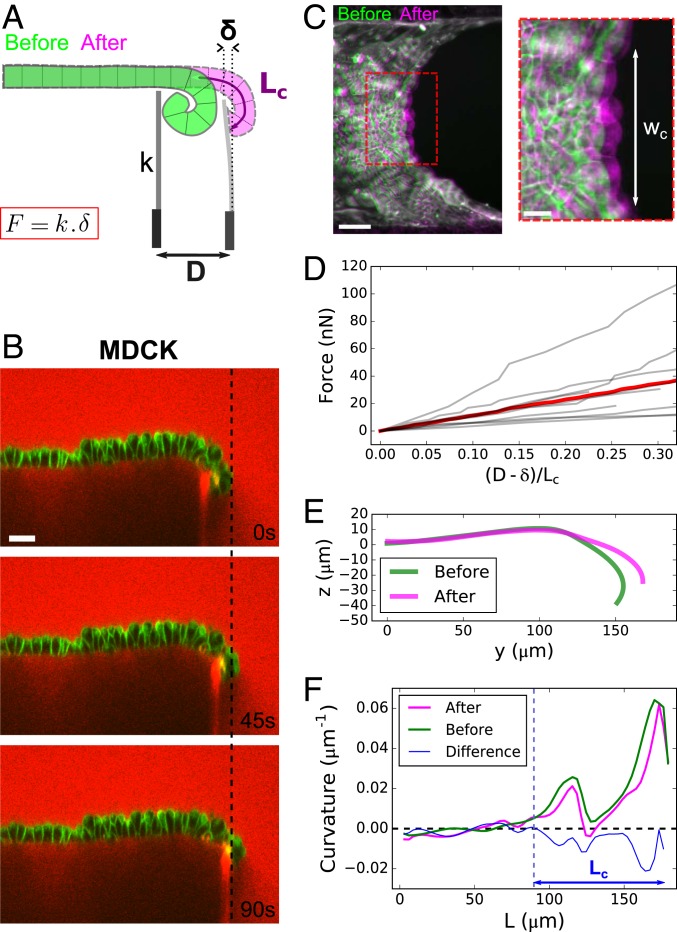
Fig. 3.
Characterization of active torques and bending modulus of epithelial monolayers. (A) Diagram of the setup to measure the bending modulus of an epithelial monolayer. A flexible glass capillary of stiffness , serving as a force cantilever, is approached close to a tissue edge (green) of curled length . The displacement imposed at the base of the cantilever generates a deflection of the cantilever, due to the restoring force of the flattened tissue (pink). (B) Time series of an MDCK monolayer imaged in profile during a ramp of displacement of the force cantilever. Dextran-Alexa647 was added to the medium (red). Note that this dye also stains the tip of the cantilever underneath the monolayer, which facilitates the measurement of its displacement. Cell membranes are marked with CellMask (green). (Scale bar: 30 m.) (C) Overlay of projected confocal stacks showing the free edge of an MDCK suspended monolayer before (green) and after (magenta) unfurling of the monolayer by the force cantilever. denotes the width of unfurled tissue. (Scale bar: 50 m.) Inset shows a zoom on the deformed region of width . (Scale bar: 20 m.) (D) Force variation along a ramp of displacement imposed at the cantilever base. The displacement of the cantilever tip is quantified by the ratio , which is equal to 1 when the tissue is fully unfurled. The gray lines represent n = 9 separate experiments; the red line represents the average. (E) Typical profile of monolayer before (green) and after (pink) unfurling of the tissue by the cantilever. (F) Typical variation of curvature of the monolayer along its contour length L before (green) and after (pink) unfolding by the cantilever. The difference between the two curves is plotted in blue. The dashed blue line indicates the transition between curled and noncurled regions of the tissue corresponding to the position where the blue curve departs from the x axis.

