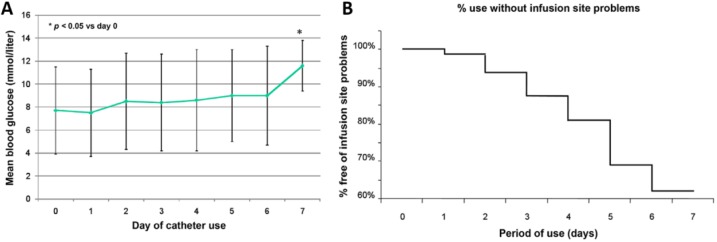
Figure 2.
(A) Mean daily blood glucose of the patients during the insertion of catheters. (B) Kaplan–Meyer curve for patients free from IIS treatment-induced adverse events. Reprinted with permission from Schmid et al,66 © 2010 by Diabetes Technology Society.

