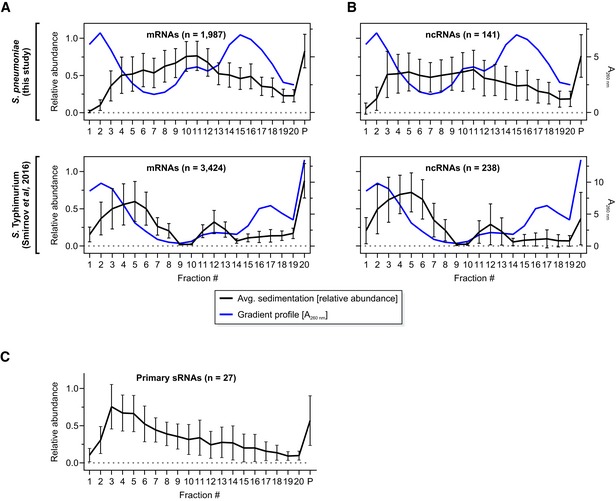
Average mRNA (A) and ncRNA (B) profiles of
Streptococcus pneumoniae (upper panels, this study) and, for comparison,
S. Typhimurium [lower panels, data from Smirnov
et al (
2016)]. As a reference, UV profiles of the gradients were added in blue [Fig
1B and Smirnov
et al (
2016)].

