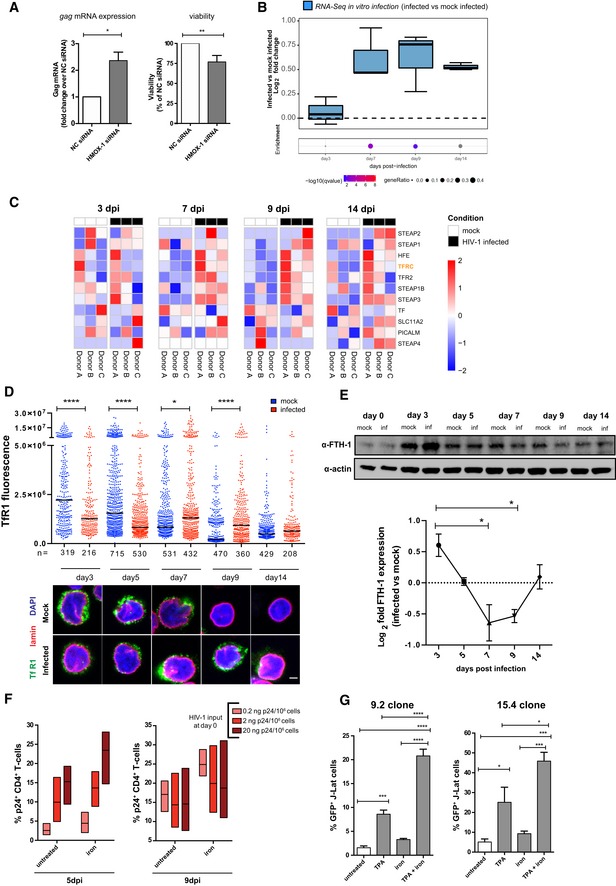
Figure 3. HIV‐1 replication alters iron metabolism and enhances iron import during transition to latency.

-
Agag mRNA expression (left) and relative viability (right) of HIV‐1‐infected Jurkat‐TAg cells transfected with non‐targeting siRNA (NC) or siRNAs targeting the HMOX‐1 gene. Cells were infected 24 h post‐transfection and assayed for mRNA expression (by qPCR) or viability (by MTT assay) 48 h post‐infection. Data (mean ± SEM; n = 3 technical replicates) were normalized using the NC control and analyzed by unpaired t‐test. *P < 0.05; **P < 0.01.
-
B, CRNA‐Seq analysis of different time points of primary CD4+ T cells infected in vitro with HIV‐1 or mock infected. The gene set used for the analyses is GO iron ion import (12 genes, GO:0097286). Data in (B) were analyzed by Fisher test. Boxplots depict median and 25–75 percentiles, while whiskers extend from the hinge to the highest or lowest value that is within 1.5 * IQR (inter‐quartile range) of the hinge. Data beyond the end of the whiskers are outliers and plotted as points. Dots below boxplots illustrate, for each time point, the pathway enrichment analysis of genes up‐regulated in infected vs. matched mock‐infected controls. Dots are color‐coded based on the enrichment q‐values, and their size indicates the fraction of DEGs in the pathway; gray dots are not statistically significant. (C) Heatmaps of the standardized expression of the GO iron ion import pathway genes in HIV‐1‐infected and mock‐infected samples over time. Expression levels were standardized [(mean gene expression − SD)/SD] for each gene in each time point. The TFRC (TfR1) gene, which was considered for further analysis, is highlighted.
-
DTfR1 expression in HIV‐1‐infected or mock‐infected CD4+ T cells as visualized by confocal microscopy. Fluorescent values shown were calculated as described in McCloy et al (2014). Data were analyzed by one‐way ANOVA followed by Sidak's post‐test to compare corresponding mock‐infected vs. infected pairs. Black dash indicates median, n = number of cells. Scale bar = 2 μm.
-
EWestern blot (upper panel) and relative expression (lower panel) of FTH‐1 protein in HIV‐1‐infected vs. mock‐infected CD4+ T cells over time. Western blot quantification was performed with Fiji‐Image J (Schindelin et al, 2012), normalized to the housekeeping protein beta‐actin and expressed as log2 fold change in HIV‐1‐infected vs. mock‐infected cells (mean ± SEM; n = 3 biological replicates). P < 0.05.
-
FPercentage of intracellular p24+ gag CD4+ T cells infected with HIV‐1 and left untreated or treated for 48 h with the iron donor Fe‐NTA at 150 μM concentration (n = 3; mean ± range of three biological replicates).
-
GPercentage of GFP+ J‐Lat cells (clones 9.2 and 15.4) left untreated or treated for 48 h with TPA (10 μM), the iron donor FeNT (150 μM), or a combination of the two. Data are expressed as mean ± SEM of four technical replicates for each cell line and were analyzed by one‐way ANOVA followed by Tukey's post‐test. *P < 0.05; ***P < 0.001; ****P < 0.0001.
Source data are available online for this figure.
