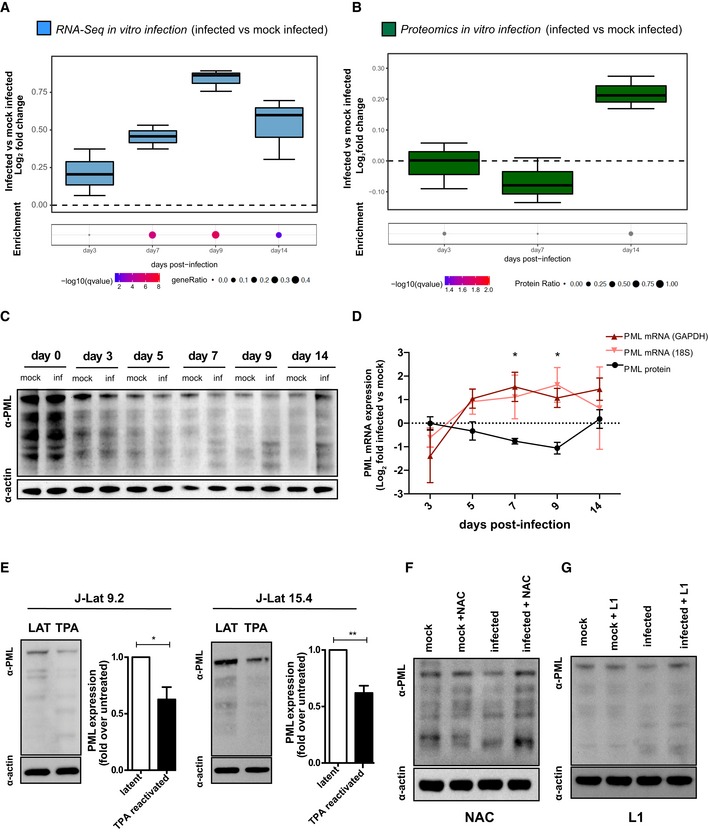
Figure 4. HIV‐1 replication drives depletion of the redox‐sensitive marker PML .

-
A, BRNA‐Seq (A) or proteomic (B) analyses of different time points in primary CD4+ T cells infected in vitro with HIV‐1 or mock infected. Data were analyzed by Fisher test (number of donors = 3 biological replicates). Boxplots depict median and 25–75 percentiles, while whiskers extend from the hinge to the highest or lowest value that is within 1.5 * IQR (inter‐quartile range) of the hinge. Data beyond the end of the whiskers are outliers and plotted as points. For each time point, dots below boxplots illustrate the pathway enrichment analysis of genes or proteins up‐regulated in infected vs. matched mock‐infected controls. Dots are color‐coded based on the enrichment q‐values, and their size indicates the fraction of differentially expressed genes or proteins in the pathway; gray dots are not statistically significant. The gene set considered for the analyses is Biocarta_PML_pathway (17 genes, M4891).
-
C, DWestern blot (C) and relative expression (D) of PML protein and mRNA in HIV‐1‐infected vs. mock‐infected CD4+ T cells over time. Raw data were normalized using actin (protein) or GAPDH or 18S (mRNA) as housekeeping control and expressed as log2 fold change expression in infected vs. mock‐infected cells. Data were analyzed by two‐way ANOVA followed by Tukey's post‐test (mean ± SEM of 3 and 4 biological replicates for PML mRNA and PML protein, respectively).
-
EWestern blot and quantification of PML protein in two different clones of J‐Lat cells left untreated or treated with TPA for 24 h. Data were analyzed by unpaired t‐test (mean ± SEM; n = 3 technical replicates for each cell line).
-
F, GPML protein expression in CD4+ T cells infected with HIV‐1 or mock infected at 7 dpi as measured by Western blot. Cells were left untreated or treated with the antioxidant compound NAC (10 mM, F) or the iron chelator deferiprone (L1, 50 μM, G).
