-
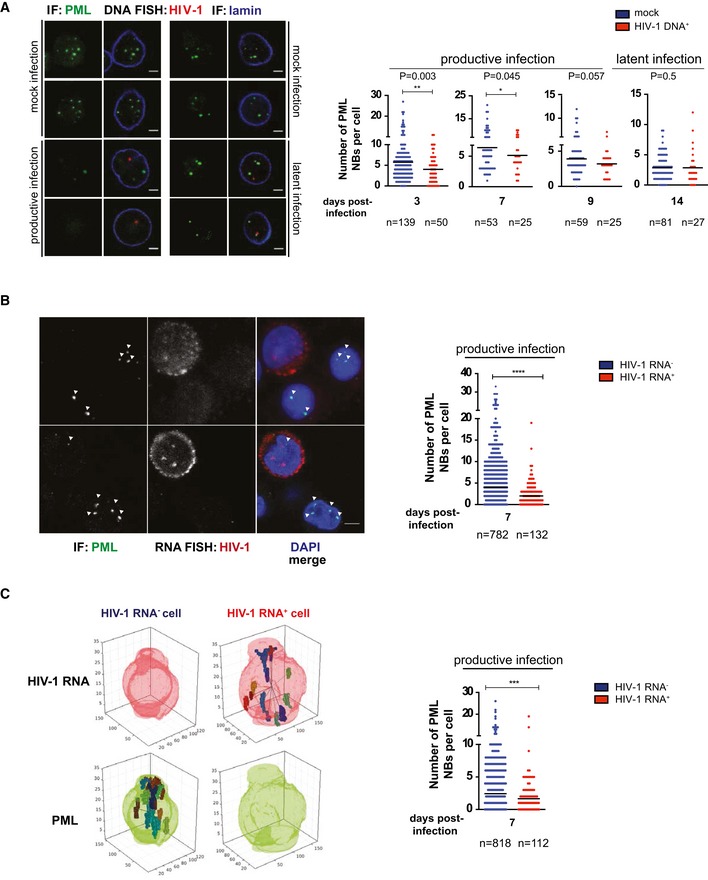
A, B
Representative image and quantification of the number of PML NBs in HIV‐1 DNA+ vs. mock‐infected (A) and HIV‐1 RNA+ vs. HIV‐1 RNA− (B) CD4+ T cells. Scale bars = 2 μm.
-
C
Representative 3D reconstruction and quantification of the number of PML NBs in HIV‐1 RNA+ vs. HIV‐1 RNA− CD4+ T cells. n = number of cells.
Data information: Infected cells were identified with either DNA (A) or RNA (B, C) FISH, and PML NBs were stained by IF. The algorithm used for automatic PML counting and 3D reconstruction is detailed in the
Materials and Methods section. Data are depicted as mean ± SEM and were analyzed by unpaired
t‐test. **
P <
0.01; ***
P <
0.001; ****
P <
0.0001.

