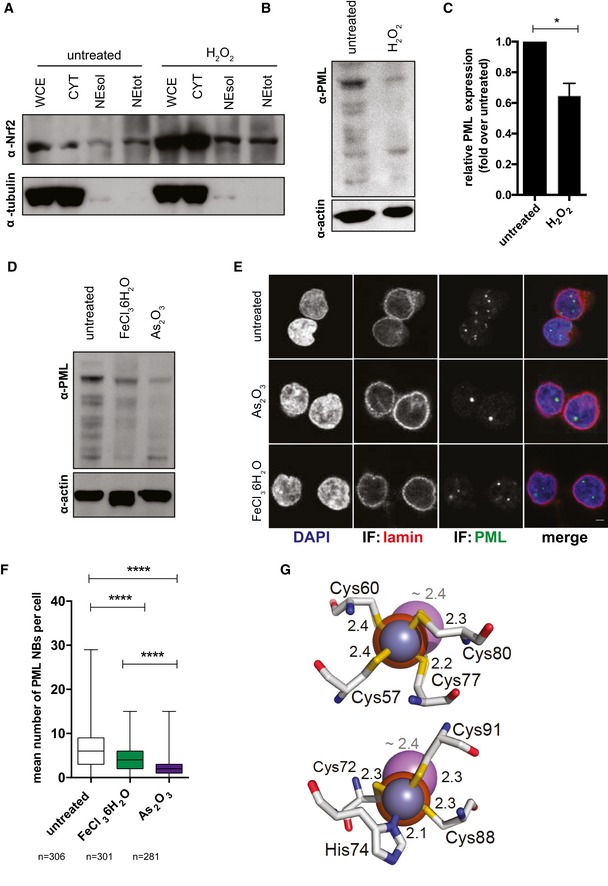
Figure EV5. Oxidative stress and iron overload can alter PML stability.

-
A–CNrf2 subcellular localization (A) and PML expression (B, C) in CD4+ T cells left untreated or treated for 30 min with 100 μM H2O2. After washing away H2O2, cells were cultured for 24 h and harvested for biochemical fractionation (A) and Western blot (A, B), (WCE) whole cell extract; (CYT) cytoplasm; (NEsol) nuclear extract soluble; (NEtot) nuclear extract total. Data in (C) were quantified with Fiji‐Image J (Schindelin et al, 2012), normalized to the housekeeping protein beta‐actin, and expressed as fold change over untreated (mean ± SEM; n = 3 biological replicates). Data were analyzed by paired t‐test. *P < 0.05.
-
D–FPML (D) and PML NB (E, F) expression in CD4+ T cells left untreated or treated for 48 h with 5 μM As2O3 or 500 μM FeCl3 6H2O as measured by Western blot (D) or immunofluorescence (E, F). Box and whisker plots in (F) depict median and min to max range. n = number of cells. Scale bar 2 μm. Data were analyzed by Kruskal–Wallis test followed by Dunn's post‐test. ***P < 0.001.
-
GStructural models of the coordination, in the PML‐ring domain (pdb code: 5yuf), of the canonical binding atom (Zn2+, blue sphere) compared to Fe(II) (orange sphere) and As3− (known to destabilize PML through direct binding (Zhang et al, 2010), purple sphere). Coordinating residues of zinc finger sites 1 (left panel) and 2 (right panel) are shown. Binding distances are indicated in Å (black for Fe(II) and Zn(II) and gray for As(III)). The predicted binding of Fe(III) overlaps with that of Fe(II), and it is excluded for simplicity.
Source data are available online for this figure.
