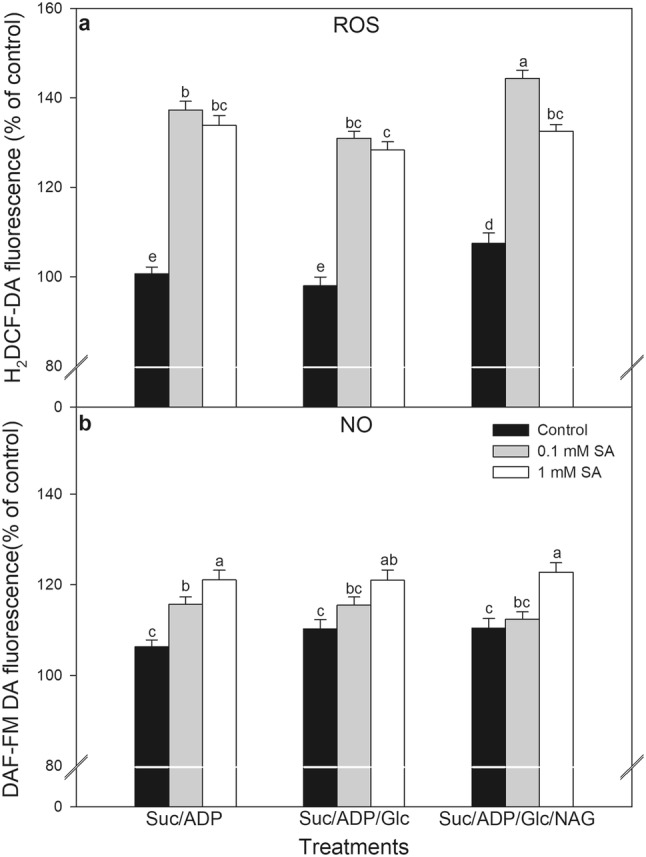
Fig. 5.

Changes in ROS (a) and NO (b) production in the presence of different modulators in mitochondrial fraction of leaves of tomato after 24 h 0.1 or 1 mM SA treatments. Suc succinate, ADP adenosine diphosphate, Glc glucose, NAG N-acetylglucosamine. Means ± SE in % of control, n = 3. Data with different letters indicate significant differences at P ≤ 0.05 level (Tukey test)
