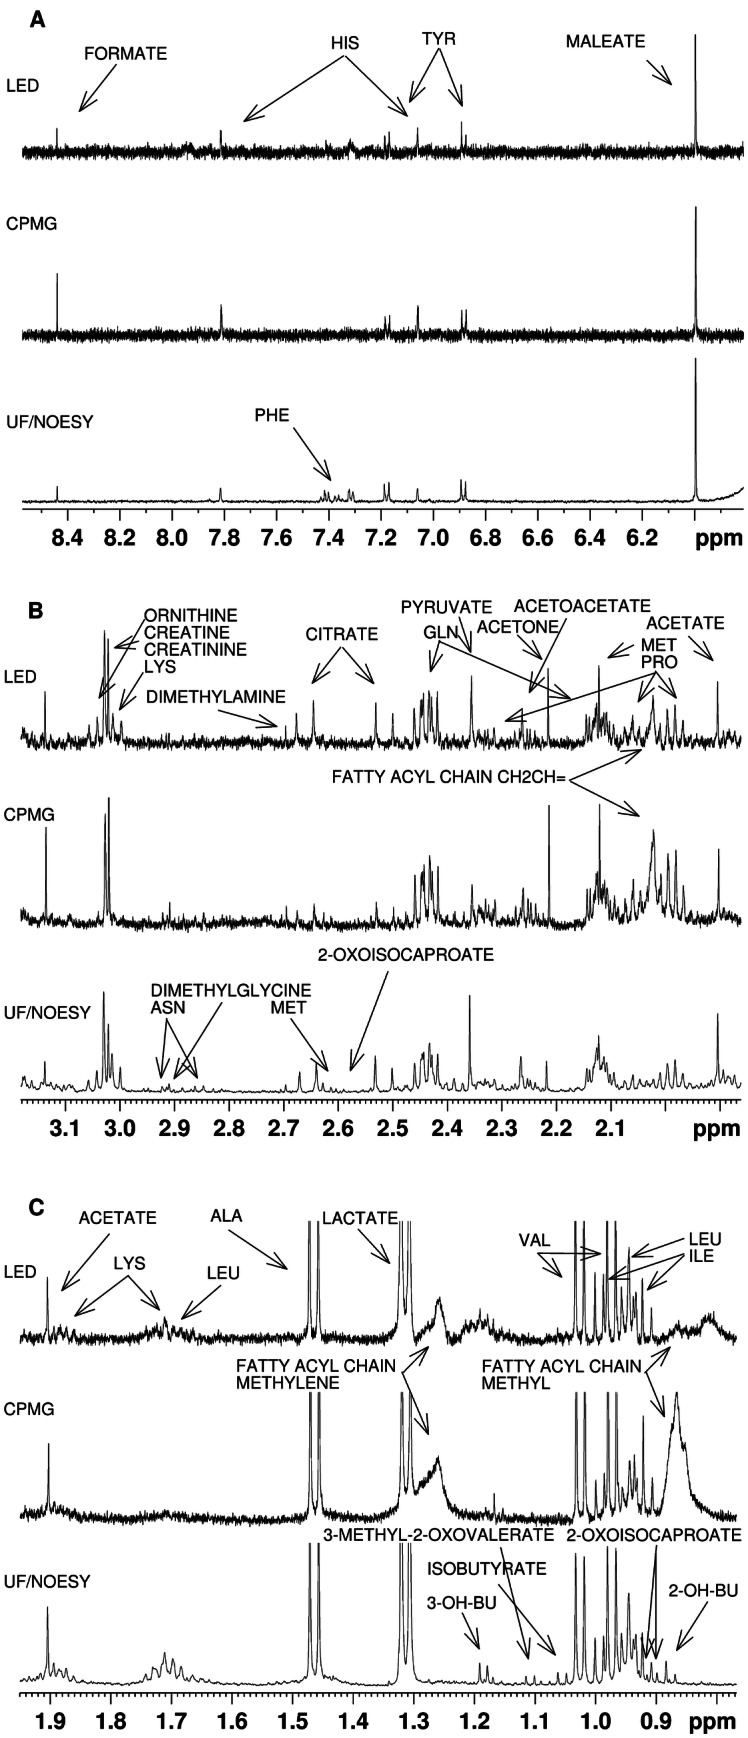
Fig. 3.

Comparison of the different macromolecular signal suppression NMR methods: diffusion edited (LED), T2-relaxation edited (CPMG), and the ultrafiltration of large molecules NOESY NMR spectrum. a The aromatic region, b the area from 3.1 to 2 ppm and c the area from 0.7 to 1.9 ppm. In each area, the peaks detectable by the LED method are annotated, whereas those only detectable in UF are assigned therein. The most striking differences between methods include the suppression of macromolecular signals and metabolites lysine, ornithine and phenylalanine that are detectable in LED but not in CPMG spectra
