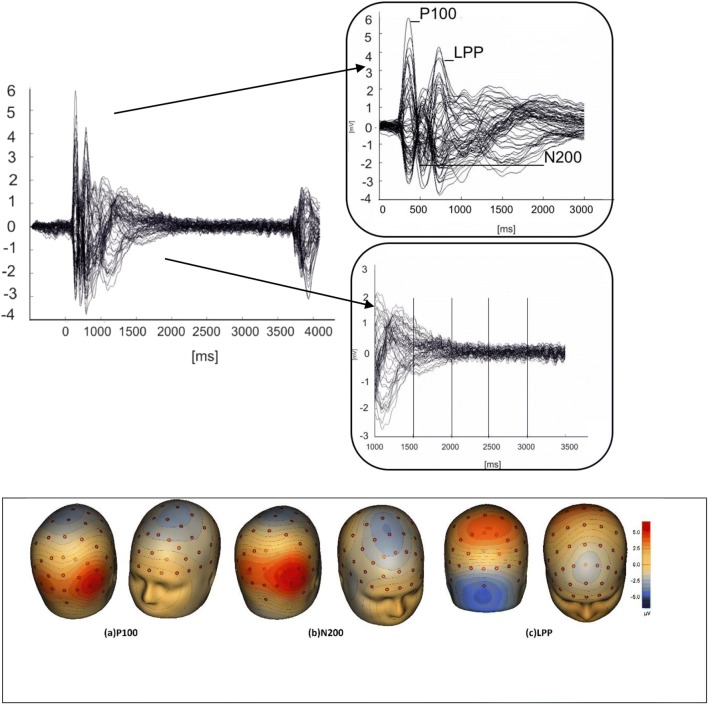
Fig. 3.
On the top left is the butterfly plot of grand average ERP responses and readiness potential to alcohol and control stimuli during the preparatory phase and corresponding scalp topographies. In the two panels on the top right, we highlight peak latencies of the distinct ERP components (123–143, 261–281 and 570–610 ms) and the following four 500 ms intervals of the readiness potential (CNV) to preparatory states to motor actions are shown. Underneath, the topographic maps of grand average ERPs overlaid on the volume rendering of the human head are shown below. a Latency component peaking at 123 ms (P100). b Latency component peaking at 261 ms (N200). c Latency component peaking at 570 ms (LPP)

