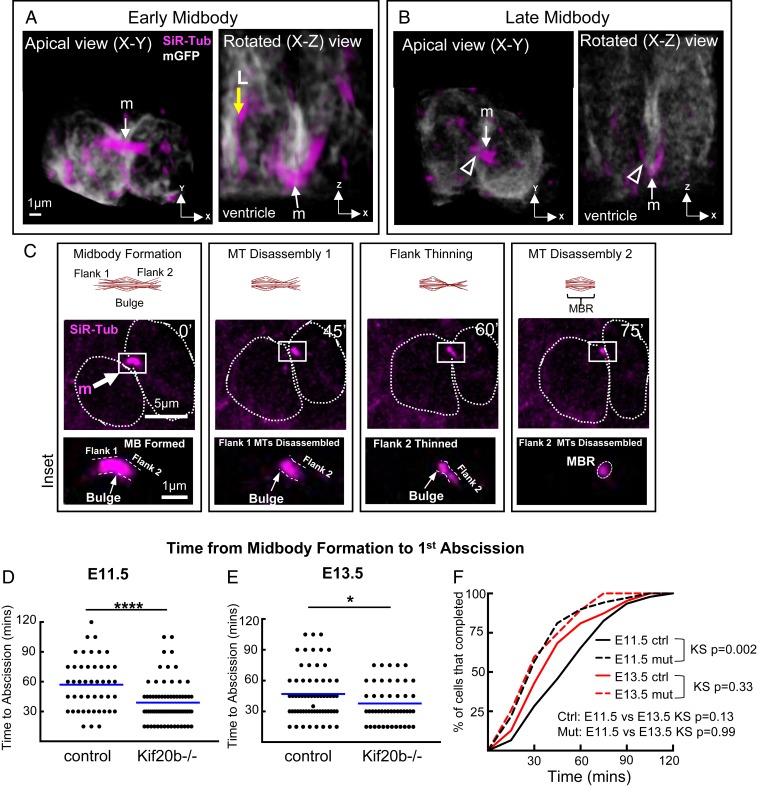
Fig. 3.
Abscission is accelerated in Kif20b mutant cortex. (A and B) The 3D renderings of NSCs at early (A) or late (B) midbody stage labeled by membrane-GFP and SiR-Tubulin viewed from both the apical view (imaging plane) and the rotated lateral view. Midbodies (m; arrows) form at the apical membrane (ventricular surface). Late midbody has thinning on one flank (open arrowheads). L, longitudinal microtubule bundles. MT, microtubules. Time shown in minutes (′). (Scale bar in A applies to all images in A and B.) (C) Schematic and images of time-lapse imaging of an NSC midbody undergoing abscission with central bulge and flanks indicated in Insets. Distinct steps seen here are midbody formation (m), microtubule disassembly on flank 1 (first abscission), flank 2 thinning, and microtubule disassembly on flank 2 (second abscission). Dotted circular outlines show the shapes of sister cell plasma membranes at a subapical plane where cells are the widest. Scale bars in C apply to all images in that row. (D and E) Time from midbody formation to first abscission is reduced in Kif20b−/− NSCs at both ages (E11.5 and E13.5). Blue lines show means. (F) Cumulative frequency plots show that E11.5 Kif20b−/− NSCs abscission timing curve is shifted to the left and has an altered shape. For E11.5, n = 46 +/+ cells (from four brains), n = 69 Kif20b−/− cells (four brains). For E13.5, n = 63 +/+ cells (five brains), n = 47 −/− cells (three brains). KS, Kolmogorov–Smirnov. *P < 0.05 (Student’s t test); ****P < 0.0001 (Student’s t test).

