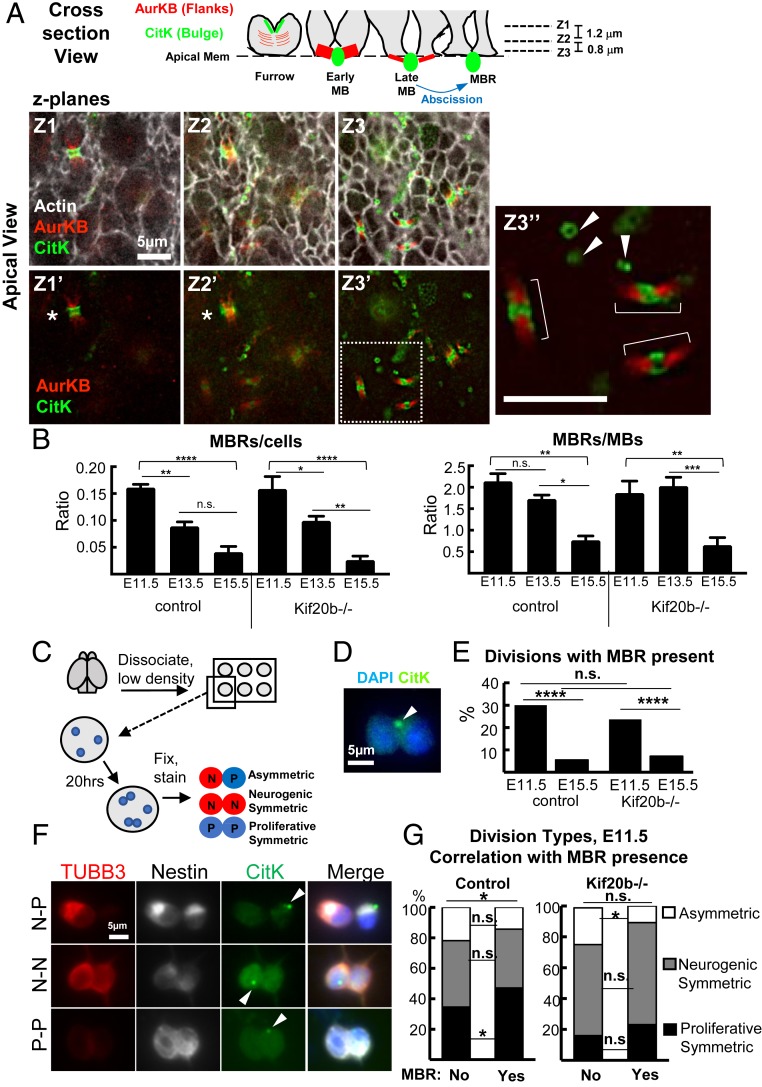
Fig. 5.
MBRs are detected at the apical membrane and correlated with early proliferative symmetric divisions. (A) Schematic and three image z planes (Z1 to Z3) of a field of apical membrane of a fixed E11.5 cortical slab show many NSC junctions (actin; white), a late furrow in planes Z1 to Z2 (asterisks), preabscission midbodies (MB) (brackets; Z3″), and postabscission MBRs in planes Z2 to Z3 (arrowheads; Z3″). AurKB labels preabscission midbody flanks. CitK labels both preabscission midbody central bulge and postabscission MBRs. (Scale bar in Z3″, 5 μm. Scale bar in Z1 applies to Z1–Z3′.) (B) Many more MBRs are seen on E11.5 and E13.5 apical membranes than E15.5 normalized to either cell number or midbody number. For E11.5, n = 4 control (three +/− and one +/+), n = 4 Kif20b−/− brains. For E13.5, n = 5 control (three +/− and two +/+), n = 5 −/− brains. For E15.5, n = 3 control (one +/− and two +/+), n = 4 −/− brains. *P < 0.05 (ANOVA); **P < 0.01 (ANOVA); ***P < 0.001 (ANOVA); ****P < 0.0001 (ANOVA). (C) Schematic of pair cell assay. (D) Pair of daughters of an E11.5 NSC division in vitro, with an associated MBR labeled by CitK (arrowhead), chromatin labeled by DAPI (4′,6-diamidino-2-phenylindole). (E) E11.5 NSC division pairs are more likely to have an MBR present than E15.5 division pairs in both control and Kif20b−/− NSCs. (F) Images of three division pairs of different fate types, each with an MBR detected (CitK+; arrowheads). Note that newborn neurons still have Nestin protein inherited from the mother NSC during the first day after division (56). N, neuron (Nestin+, Tubb3+); P, progenitor (Nestin+, Tubb3−). (Scale bar applies to all panels in F.) (G) The proportions of division types were compared in pairs with or without an MBR present. Control NSC division pairs with MBRs are more often proliferative symmetric (P-P). Kif20b−/− NSCs have reduced proliferative symmetric divisions with or without an MBR present. For E11.5, n = 394 control (three +/− and two +/+ brains), n = 272 Kif20b−/− divisions (four brains). For E15.5, n = 241 control (four +/− brains and one +/+ brain), n = 280 Kif20b−/− divisions (five brains). n.s., not significant. For individual category distributions in E and G, *P < 0.05 (Fisher’s exact test); ****P < 0.0001 (Fisher’s exact test). For overall distributions in G, *P < 0.05 (χ2 test).

