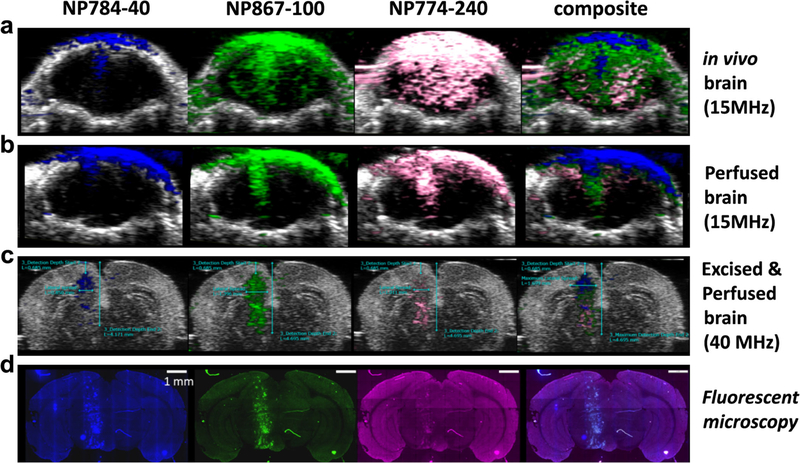
Fig. 6.
SUPAI and photoacoustic images normalized for dye concentration (a–c) and fluorescent microscopy images (d) of studied NPs in the mouse brain following FUS mediated BBBD. All images are coronal view/sections located at one of the FUS BBB openings (panel f shown in Fig. 5). Scale bar = 1 mm. The colors in PAI correspond to the filter used in FI to detect fluorophore-labeled NPs.

