
Fig. 2.
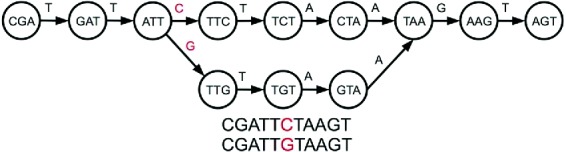
A bubble in a De Bruijn graph that represents a SNP; we arbitrarily consider one side of the bubble to be the ‘0’ path and the other to be the ‘1’ path. In the compressed De Bruijn graph, the ‘0’ and ‘1’ paths are each a single node.
Official websites use .gov
A
.gov website belongs to an official
government organization in the United States.
Secure .gov websites use HTTPS
A lock (
) or https:// means you've safely
connected to the .gov website. Share sensitive
information only on official, secure websites.
A bubble in a De Bruijn graph that represents a SNP; we arbitrarily consider one side of the bubble to be the ‘0’ path and the other to be the ‘1’ path. In the compressed De Bruijn graph, the ‘0’ and ‘1’ paths are each a single node.