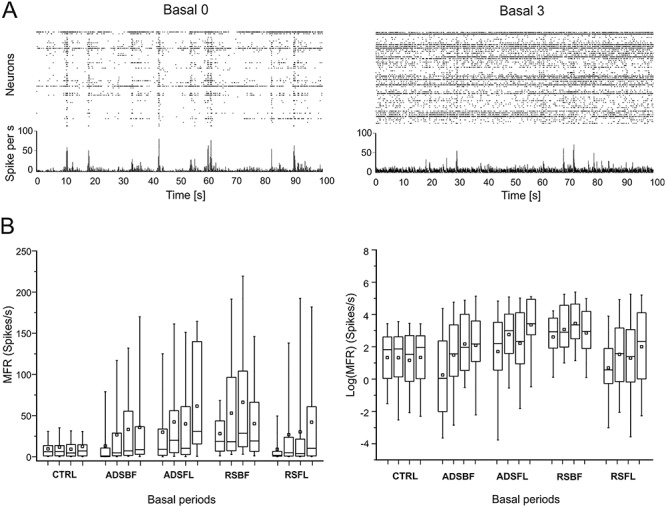
Figure 2.

Firing rate analysis. (A) Spike rasters (dotted graphs, one row per sorted unit) and corresponding array-wide firing rate (line graphs) measured by summing all spikes detected on the entire array in 1-ms windows during 100-ms time frame of Basal0 (left) and Basal3 (right) for a single representative animal which underwent the ADS protocol in BF. (B) Left: Quantitative representation of the MFR distributions for each experimental group (CTRL; ADSBF; ADSFL; RSBF; RSFL) in each Basal phase (0–3). Right: Representations of the Log (MFR) distributions of each experimental group and for each basal period. Data are summarized in box plots, where the horizontal lines denote the 25th, median, and 75th percentile values and the whiskers denote the 5th and 95th percentile values; the square inside the box indicates the mean of each data set. Statistical analysis is reported in Tables 2 and 3.
