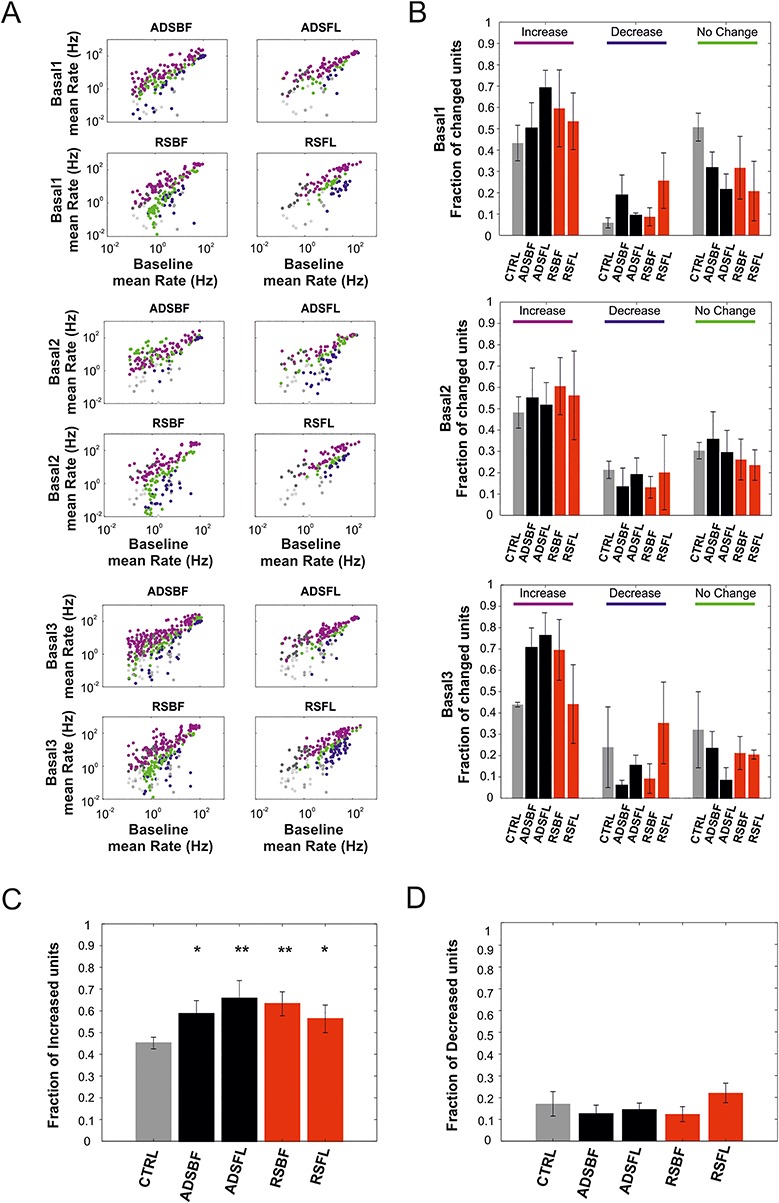
Figure 3.

(A) Per unit correlation between baseline firing rates (x-axis, Basal0) and firing rates after each stimulation session (y-axis, Basal1–3) calculated for each group (ADSBF, ADSFL, RSBF, and RSFL). Colors represent units that significantly increased (magenta), decreased (blue), or remained stable (green). Gray dots represent the correlation for the control group (CTRL). (B) Average fraction of units that significantly changed their firing with respect to the baseline period of recording (Basal0) calculated for all the five experimental groups (i.e., CTRL, light gray; ADSBF and ADSBF, black; RSBF and RSFL, red). (C) Average fraction of neurons which increased their firing rate across the five experimental groups. (D) Total fraction of neurons which decreased their firing rate. (*P < 0.05, relative to CTRL; one-way ANOVA with Dunnett’s multiple comparison test. Error bars represent SEM). Data are reported as mean ± SEM (standard error of the mean).
