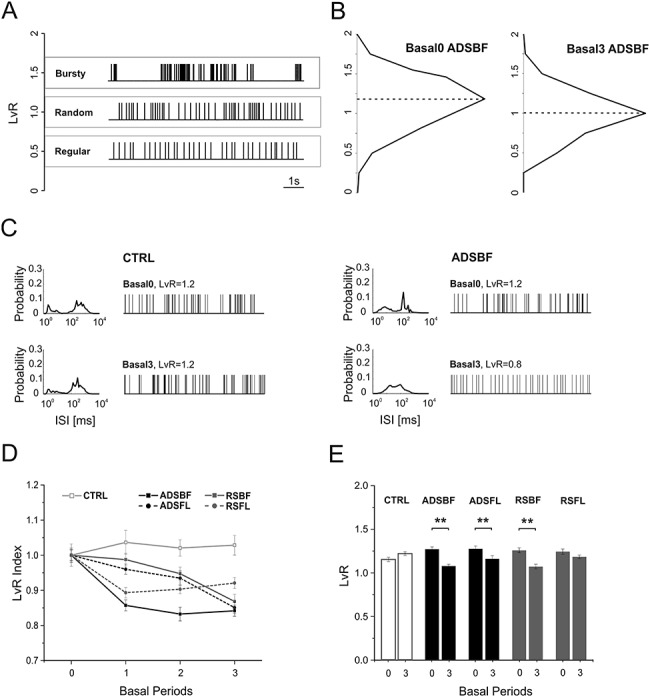
Figure 4.

(A) Example spike sequences of representative neurons with LvR of 0.5 (Regular, red), 1 (Random, green), and 1.5 (Bursty, blue) taken from data set ADSBF. (B) LvR distributions shown as histograms with a common bin size 0.25 and determined across all the subjects belonging from ADSBF during the first (Basal0, left) and last (Basal3, right) period of quiescence. Black dotted lines represent the median of the LvR distributions. (C) Distributions of a representative neuron’s ISI and its sample firing pattern consisting of 100 consecutive ISIs belonging to the CTRL group (Left) and ADSBF group (right), respectively, during Basal0 (top) and Basal3 (bottom). (D) Mean ± SEM trend of normalized LvR for each experimental condition. Each subject’s LvR value was normalized over the mean LvR value calculated during Basal0: statistical analysis is reported in Tables 4 and 5. (E) Mean ± SEM LvR comparison between Basal0 and Basal3 for all the experimental conditions (CTRL, grey; ADSBF and ADSFL, black; RSBF and RSFL, red). **P < 0.01; unpaired, two-tailed Student’s t-test.
