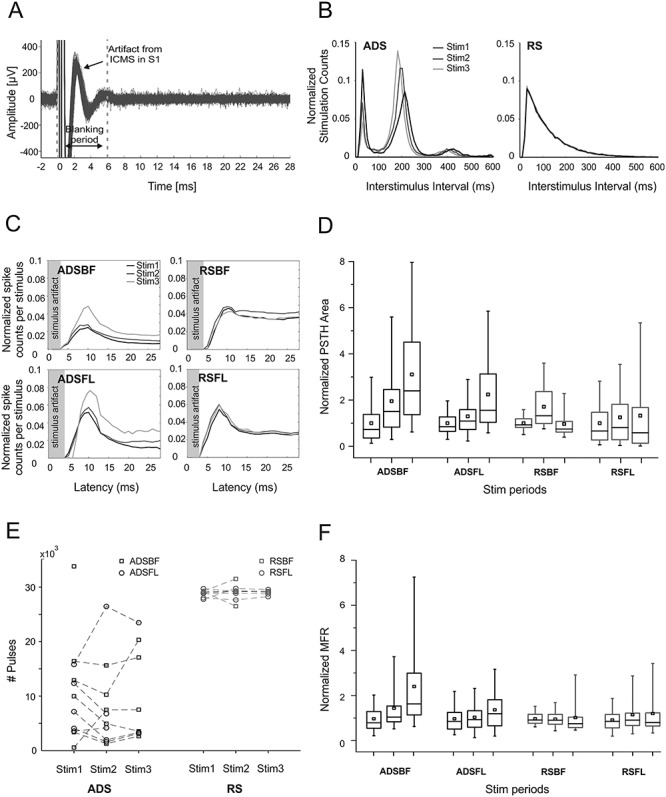
Figure 5.

(A) Sample trace of recordings from RFA showing stimulus artifacts from ICMS delivered to S1BF. Blanking period used for the analysis is delimited by the gray dotted lines. A total of 100 superimposed traces are shown. (B) Stimulation interval distribution (Interstimulus intervals, 600 ms) in both one ADS and RS subject during the three stimulation sessions (Stim1, Stim2, and Stim3). Stimulation counts have been normalized to session length. (C) Poststimulus spiking histograms derived from neural recordings in RFA on the three stimulation sessions for the four ICMS groups, respectively (ADSBF, ADSFL, RSBF, and RSFL). Histograms portray the average number of action potentials discriminated from the neural recordings within 1-ms bin. Data pooled across subjects for each group and normalized to the total number of either ADS or RS specific events. (D) Normalized PSTH areas for the four groups (ADSBF and ADSFL, black; RSBF and RSFL, red) of ICMS in the three stimulation phases (Stim1, Stim2, and Stim3). Each subject’s PSTH area was normalized over the mean area calculated in Basal0 to show data trends over time. (E) The number of stimulation pulses delivered for both ADS (black) and RS (red) during the three stimulation phases. (F) MFR of the stimulation phases normalized over the mean value of firing during Stim1. Statistical analysis is reported in Tables 6–9.
