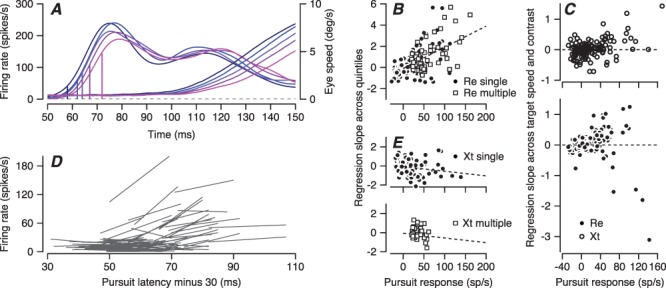
Figure 10.

Direct tests of the ramp-to-threshold hypothesis for individual neurons in FEF SEM . A: Firing rate (left-hand traces) and eye velocity (right-hand traces) for an example neuron divided into quintiles according to pursuit latency in individual trials and plotted as a function of time from the onset of target motion. The five vertical lines on the firing rate traces show the values of firing rate 30 ms before the latency of eye velocity in each quintile. B, E: Slope of the regression line versus amplitude of the pursuit-related response. A slope of zero would support the ramp-to-threshold hypothesis. Each symbol shows a different neuron. Filled circles show data from earlier single direction experiments and open squares show data from the current multiple directions experiments. Panel B shows data from monkey Re and panel E shows data from monkey Xt. C: Same plot as (B, E), but now using data solely from our earlier single-direction experiments and plotting the regression slopes for points taken from targets of high- or low-contrast moving at 2, 10, or 20 deg/s. D: Linear regression lines fitted to each FEFSEM neuron’s plots of firing rate 30 ms before the onset of pursuit versus pursuit latency for the 5 quintiles of pursuit latency. Each line shows data for a different neuron.
