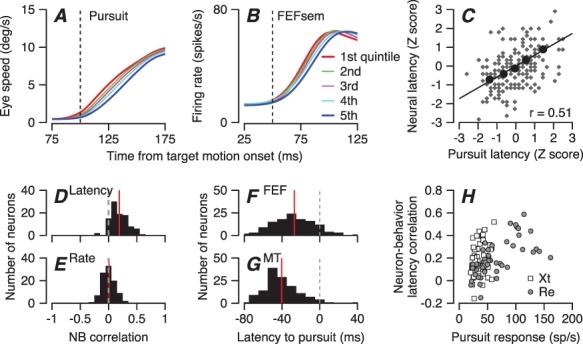
Figure 2.

Trial-by-trial relationships between latency variation in pursuit behavior and firing of FEF SEM neurons. A: Eye speed versus time during the initiation of pursuit. B: Population average firing rate of FEFSEM neurons in the same intervals. In (A, B), the five traces in each panel show data for quintiles of trials sorted by the latency of pursuit. Red and blue traces show data for the shortest and longest latency group. Green, purple, and cyan show data for the middle groups. C: Plot of z-scored neural latency versus z-scored pursuit latency for an example neuron. Black circles show data for the 5 quintiles based on pursuit latency and small gray symbols show measurements for individual trials. Line was obtained by regression on large black symbols. D: Distribution of response latency-pursuit latency correlations for 99 FEFSEM neurons. E: Distribution of response amplitude-pursuit latency correlations. F, G: Distributions of latency from neural responses in MT and FEFSEM to the onset of pursuit. H: Relationship between FEFSEM neural response amplitudes and neuron-behavior latency correlations. The correlation between neural responses and neuron-behavior latency correlations was 0.46 (Pearson’s correlation, P = 1.4×10⁻⁶). Different symbols in H show data recorded in different monkeys.
