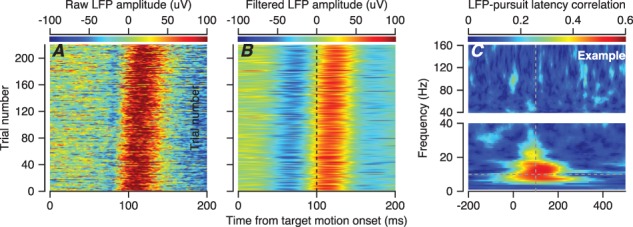
Figure 3.

Example recording session showing the temporal alignment of LFP with the onset of pursuit. A: Each line of the plot shows the LFP for one trial as a function of time, and colors show the amplitude of the LFP. B: The data from A have been replotted after filtering with a 5–15-Hz bandwidth. In both A and B, the trials have been ordered by the behavioral latency of pursuit. C: The color of each pixel plots the trial-by-trial correlations between pursuit latency and the phase of the LFP for this example recording session as function of LFP frequency in 1-Hz bands and time from the onset of target motion. We have broken the y-axes in C into two segments with different scales to improve the visibility of the larger values of correlation in the lower frequency ranges.
