
Figure 4.
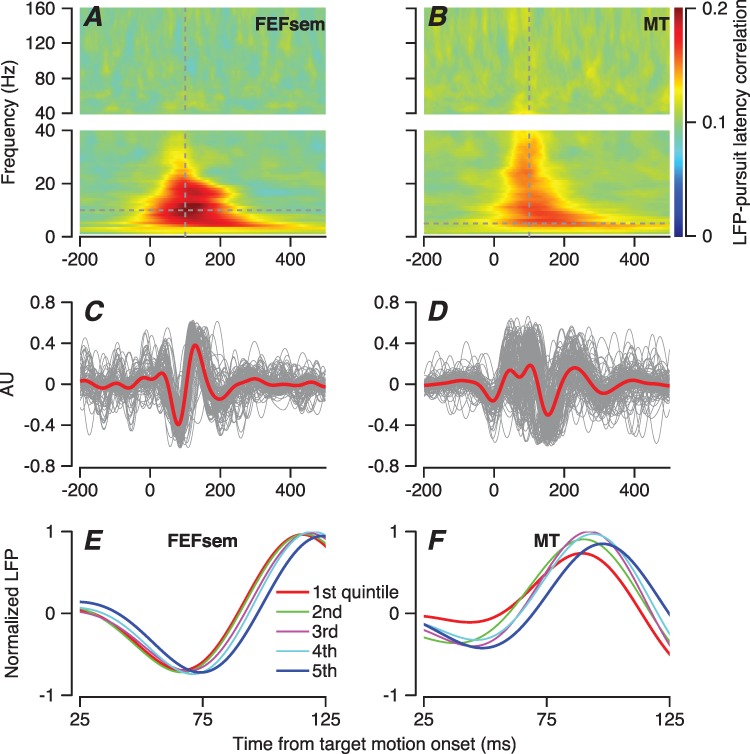
Local field potential and its correlation with the latency of pursuit. A, B: The color of each pixel plots the trial-by-trial correlations between pursuit latency and the phase of the LFP averaged across 123 sites in FEFSEM (A) and 138 sites in MT (B) as function of LFP frequency in 1-Hz bands and time from the onset of target motion. We have broken the y-axes in A and B into two segments with different scales to improve the visibility of the larger values of correlation in the lower frequency ranges. C, D: Traces for local field potential filtered with a bandpass of 5–15 Hz for FEFSEM (C) and MT (D). Red and gray traces show averages across all the recordings and data from individual average recordings for the FEFSEM. Data have been plotted in arbitrary units to improve visibility of recordings with different amplitudes of LFP. E, F: LFP sorted into quintiles according to pursuit latency, after normalizing individual-filtered LFPs from individual trials by the maximum peak to trough distance. Red and blue traces show data for the shortest and longest latency group. Green, purple, and cyan traces show data for the middle groups. Example neurons recorded in FEFSEM (E) and MT (F).