
Figure 5.
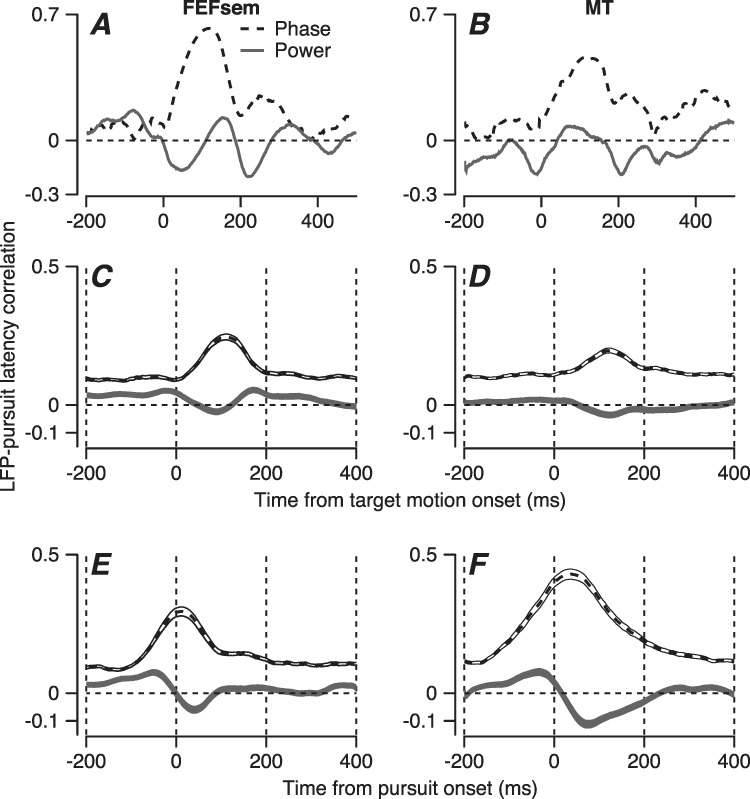
Quantitative analysis of the relationship between local field potential and pursuit latency. Graphs show example recordings in FEFSEM (A) and MT (B) and averaged across all recording sites in FEFSEM (C) and MT (D) as a function of the time during the wave. E and F show the same analysis as in C and D, but now with the time of the phase and power measurements aligned relative to the onset of pursuit instead of the onset of target motion. Dashed and black traces show correlations of the LFP phase versus power, and the ribbons around the traces in (C, F) show the standard error of the mean across recordings.