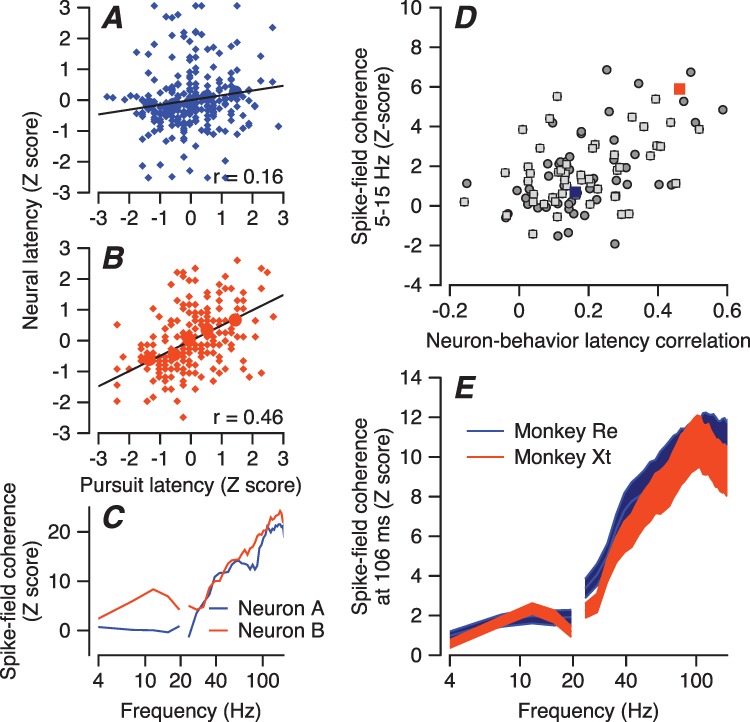
Figure 6.

Relationship between spike-field coherence and FEF SEM -pursuit latency correlation. A, B: Plots of z-scored neural latency versus z-scored pursuit latency for two example neurons. Navy blue and orange circles show data for the 5 quintiles based on pursuit latency, and smaller diamond symbols show measurements for individual trials. Lines were obtained by regression on the large filled symbols. FEFSEM-pursuit latency correlation of the neurons in panels A and B are low versus high. C: Z-scored spike-field coherences of the two example neurons as a function of frequency measured at a time window centered at 106 ms from motion onset. Colors match A and B. D: Each symbol shows data for a different neuron, and the scatter plot shows the correlation between z-scored spike-field coherences and FEFSEM-pursuit latency correlations. Orange and navy-blue squares are data of example neurons. Dark gray circles and light gray squares are data from monkeys Re and Xt. E: Spike field coherence as a function of LFP frequency, plotted in different colors for the two monkeys.
