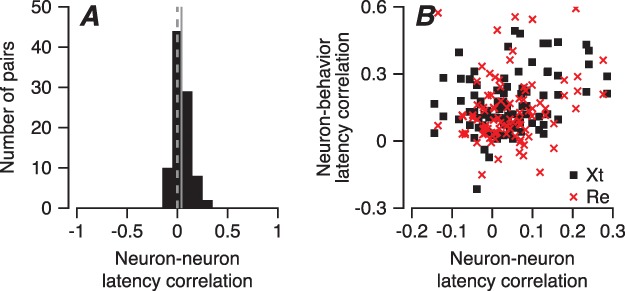
Figure 8.

Neuron–neuron latency correlations in pairs of FEF SEM neurons. A: Distribution of neuron–neuron latency correlations between pairs of FEFSEM neurons. The vertical solid line shows the mean correlation, and the vertical dashed line denotes zero correlation. B: Each point plots data for a different FEFSEM neuron, and the scatter plot shows the relationship between that neuron’s FEFSEM-pursuit latency correlation and its neuron–neuron latency correlation with a simultaneously recorded neuron. Red x’es and black squares are data from monkeys Re and Xt.
