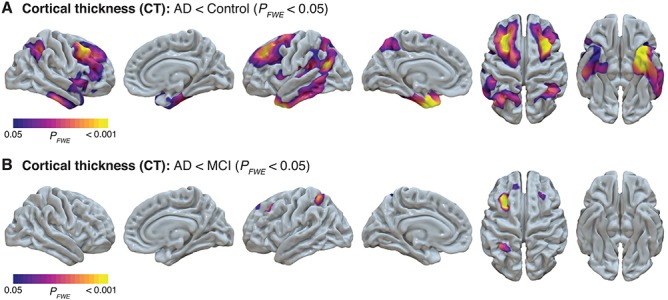
Figure 3.

Decreased cortical thickness in AD dementia groups from whole-brain CAT surface-based analysis. CAT12 surface-based analysis demonstrated areas of decreased cortical thickness in the AD dementia group relative to the control group (A) and the AD dementia group relative to the MCI group (B). CAT12 statistical maps were projected onto surfaces in Surf Ice and indicate areas with significant (FWE-corrected P < 0.05) differences.
