
Figure 5.
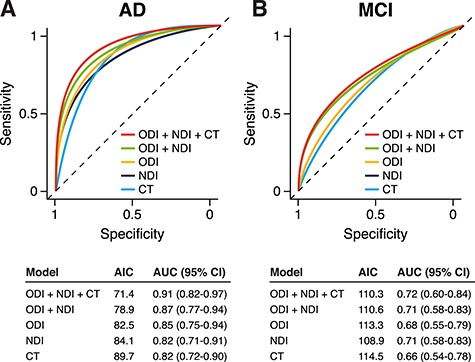
ROC curves from exploratory logistic regression models using NODDI microstructure and/or cortical thickness. For NDI, ODI, and cortical thickness (CT), per-subject parameters for each metric were used in logistic regression models (along with age and sex) to predict diagnosis of AD dementia (A) and MCI (B). Model summary tables below the ROC curves display AIC and AUC with bootstrapped 95% confidence intervals (CI).