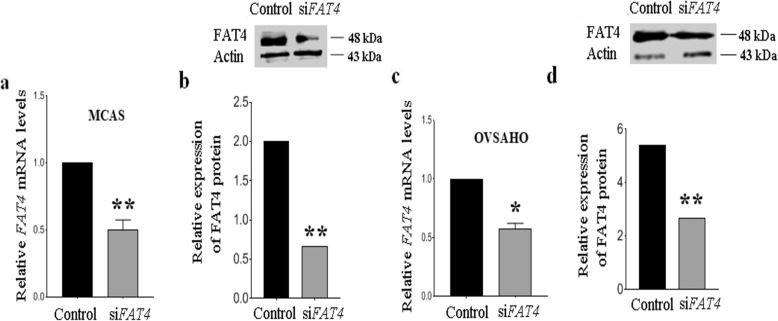
Fig. 2.
a. Relative expression of FAT4 in MCAS cells following its knockdown at a. mRNA level, and b. protein levels. FAT4 was knocked down significantly (p = 0.0016) in MCAS. Full-length blots are presented in Supplementary figure S1. c. Relative expression of FAT4 in OVSAHO cells following its knockdown at a. mRNA level, and d. protein levels. Full-length blots are presented in Supplementary figure S1. FAT4 was knocked down significantly in OVSAHO (p = 0.0055). Data represent mean and standard deviation from at least three independent experiments performed in triplicates

