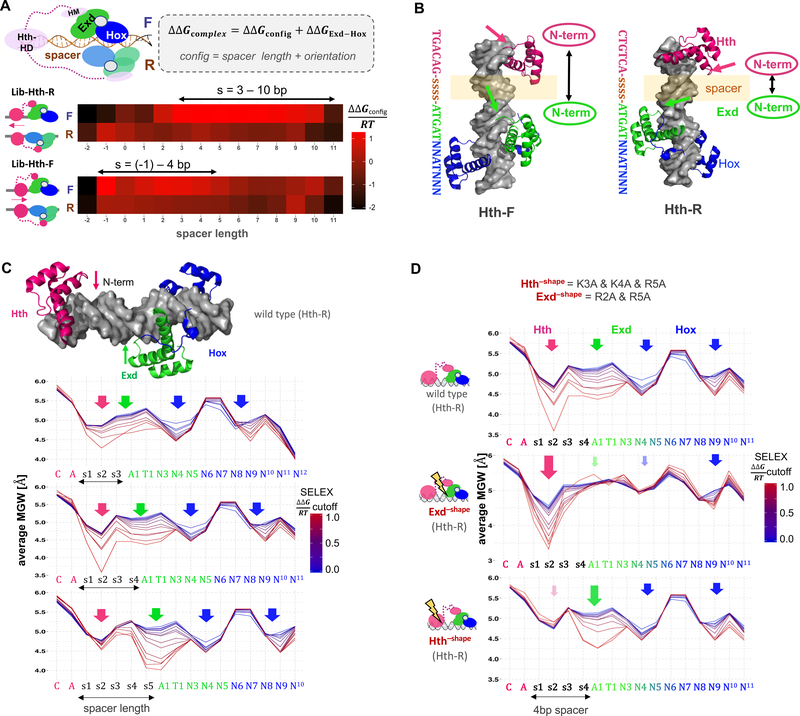
Figure 2: Dissecting DNA minor groove width readout by a ternary homeodomain complex.
See also Figures S1 and S2.
(A) Systematic analysis of binding configurations of the ternary HthFL-Exd-Hox complex. SELEX probe counts after two rounds of affinity-based selection were analyzed using a generalized linear model that estimates the free energy associated with each configuration (i.e., the length of DNA spacer between the Hth and Exd-Hox sites, and their orientation with respect to each other) while accounting for the dependence on DNA sequence based on the enrichment of 12-mers observed for the simpler HthHM-Exd-Hox complex. Heatmaps show ΔΔG coefficients (in units of RT) for each particular configuration; red indicates stronger binding. (B) Superposition of Meis1 (human ortholog of Hth; PDB-ID: 4XRM) and Exd-Hox (PDB-ID: 2R5Y) crystal structures onto B-DNA templates (http://structure.usc.edu/make-na/) consisting of a Hth-F (TGACAG) or Hth-R (CTGTCA) binding site, followed by a 4-bp spacer (indicated by “ssss”) and an Exd-Hox site (2R5Y). Arrows indicate the relative positioning of the N-terminal domain of each HD (Hth: pink; Exd: green). (C-D) Average minor groove width (MGW) profiles at increasingly stringent SELEX binding affinity cutoffs, for (C) HthFL-Exd-Hox (Lib-Hth-R) and three different spacer lengths (3–5 bp), (D) HthFL-Exd-Hox for a 4 bp spacer, contrasting all wild-type (top), shape-defective Exd (middle) or shape-defective Hth (bottom). Arrows indicate the position of N-terminal arm MGW readout, color saturation and arrow size indicate the loss or gain of specific MGW minima respectively.

