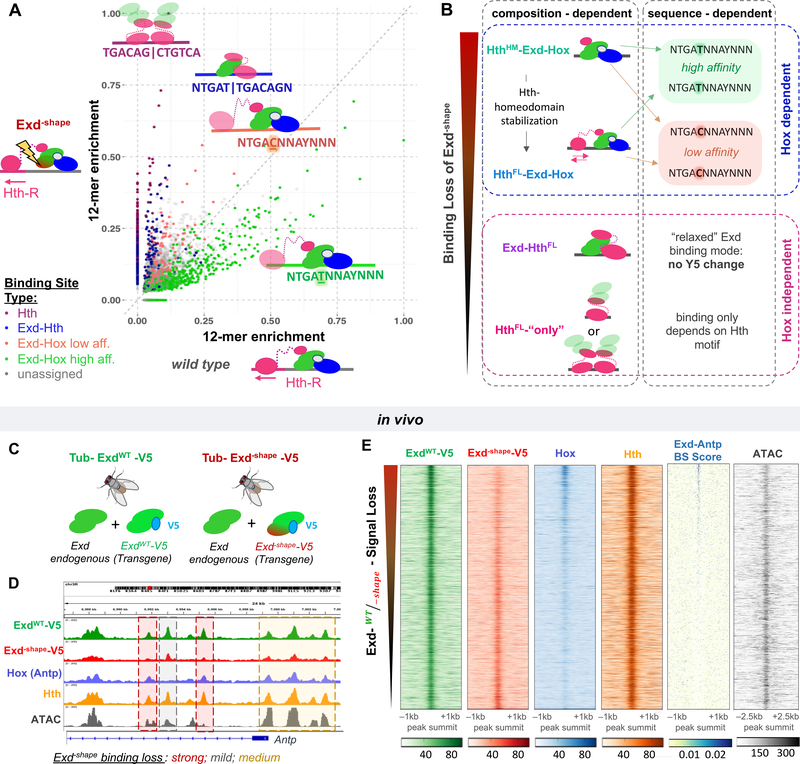
Figure 4: A shape readout mutant distinguishes between TF complexes in vitro and in vivo.
See also Figure S3.
(A) Classification of 12-mer DNA sequences in terms of their observed in vitro relative enrichment (Lib-Hth-R) in the presence of HthFL, Hox, and either ExdWT or Exd–shape. Points/sequences are colored according to which particular HD complex best explains their enrichment: Hth dimers (purple), Exd-HthFL (dark blue), or HthFL-Exd-Hox (low-affinity: Y5=C, NTGACNNAYNNN, coral red; or high-affinity: Y5=T, NTGATNNAYNNN; green). (B) Schematic illustrating the context dependence of binding loss due to the Exd–shape mutation. (C) To perform in vivo validation, transgenes carrying either ExdWT or Exd–shape tagged with V5 were inserted into the attp40 landing site on chromosome II in the background of endogenous Exd. (D) Tracks showing, at the Antp locus, the result of anti-V5 ChIP-seq experiments performed on third instar larval wing discs of flies homozygous for tub>exdWT-V5 (green) or tub>exd–shape-V5 (red) transgenes and endogenous Exd. Hth (orange) and Hox (Antp; blue) ChIP-seq, as well as ATAC-seq (gray) tracks are also shown for reference. Background shading indicates peaks that are strongly lost (red), mostly unaffected (gray), or partially lost (yellow) by the Exd–shape mutation. (E) Raw coverage tracks around the ExdWT-V5 ChIP-seq peak summit for IP signals from ExdWT-V5, Exd–shape-V5, Hox, and Hth, along with binding site (BS) affinity scores for Exd-Antp, and ATAC-seq signal. Peaks are ordered by the ExdWT-V5 over Exd–shape-V5 IP-signal ratio (“Exd–shape binding loss”).

