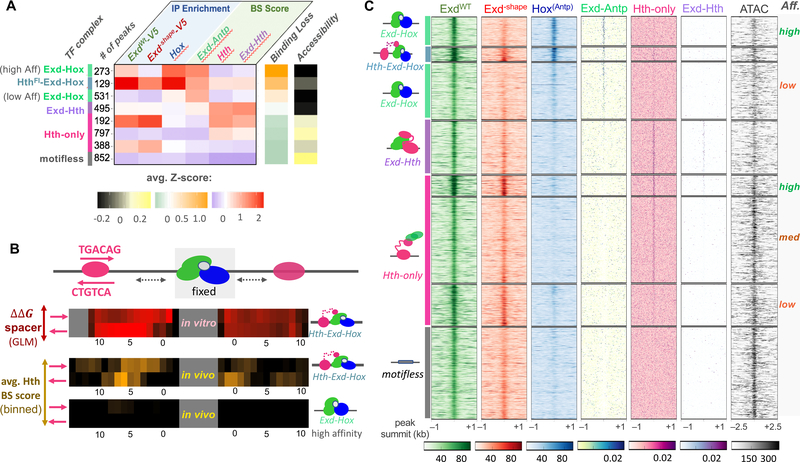
Figure 5: Attribution of binding complex composition in vivo using the Exd–shape mutant.
See also Figure S4.
(A) Classification of all ExdWT-V5 peaks based on ChIP-seq enrichment for ExdWT-V5, GFP-Antp, and Exd–shape-V5 and predicted binding site affinity for Exd-Antp, Hth-monomer, and Exd-Hth. The heatmap shows average Z-scores across all six input features for each cluster. Average Z-scores for Exd–shape binding loss and ATAC-seq signal (the latter not used for the clustering) are shown using orange-green and yellow-black color scales, respectively. The number of peaks per cluster and the assigned complex are indicated on the left. (B) Comparison of length preferences for the spacer between the Exd-Hox and Hth binding sites between in vitro and in vivo context. Estimated binding free energy for all four possible Hth configurations centered around the [Exd-Hox]F site derived from SELEX data is shown in the top panel (red-black color scheme). The middle and bottom panel indicate the 4-bp moving average binding site score for Hth centered around the highest-scoring Exd-Hox site for either the 129 trimer (middle) or 273 high-affinity Exd-Hox cases (bottom). (C) Raw tracks for IP coverage and binding affinity centered around each peak summit for all six input features, along with the ATAC-seq signal. The deduced identity of the bound complex for each cluster is indicated on the left and affinities are shown on the right.

