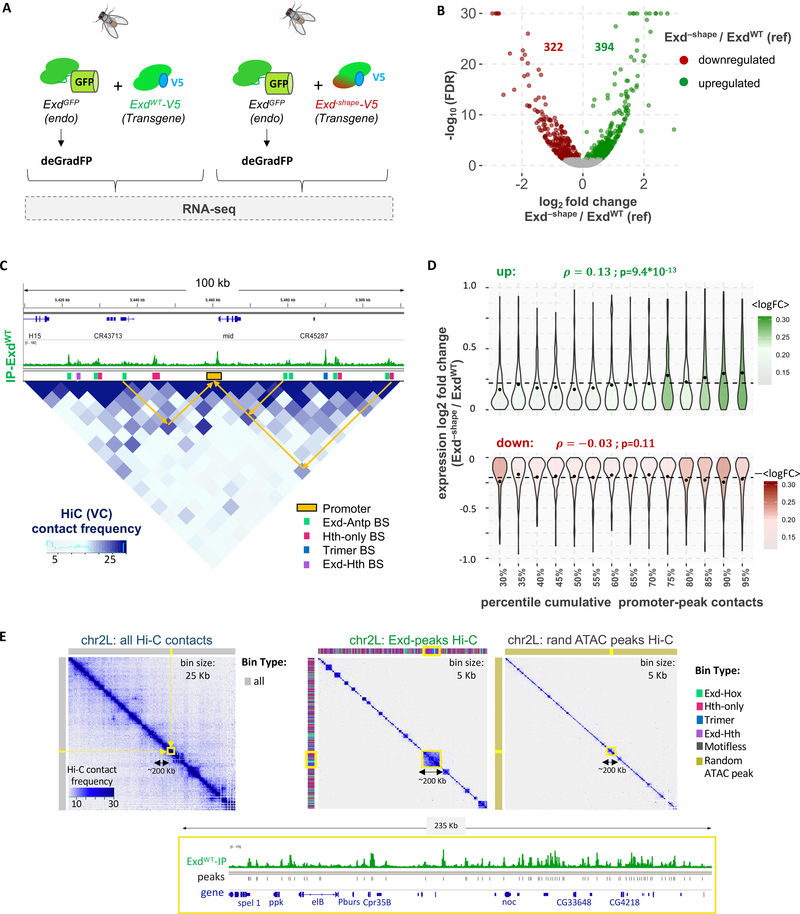
Figure 6: Using Exd–shape to perturb complex-specific gene networks.
See also Figures S5 and S6.
(A) Using the Exd–shape mutation as a genetic tool to dissect the gene expression response of Exd-Hox binding loss in vivo. CRISPR-Cas9 based tagging of the endogenous Exd locus with GFP allows time-controlled removal of endogenous Exd protein using the deGradFP system in the background of either tub>exdWT-V5 or tub>exd–shape-V5 transgenes. (B) Volcano plot of the false discovery rate (FDR) versus the log2-expression-fold change in Exd–shape compared to ExdWT (reference) is shown. Genes upregulated in Exd–shape are shown in green; downregulated genes in red. (C) Using Hi-C data to assign peaks to the promoter they contact the most. Shown is a region on chromosome 2L encompassing the mid gene locus. ExdWT-V5 IP coverage track is shown above the Hi-C map at 5-kbp resolution. Promoter regions (orange) and different HD complex types are shown as colored boxes. Arrows indicate examples of contacts in 3d space between enhancers (peaks) and promoters. (D) Cumulative promoter to Exd-peak contact frequency is significantly correlated with expression log2-fold-change for upregulated (green), but not downregulated genes (red). (E) Hi-C contact maps of wild-type (including tub>exdWT-V5 transgene) wing discs for chromosome 2L showing either all chromatin contacts (left; binned at 25 Kb resolution), a selection based on the set of all Exd peaks (middle; binned at 5Kb resolution), or one based on a size-matched random sample of ATAC-seq peaks (right; binned at 5Kb resolution). Color bars above and next to each plot show the type of chromatin bin. The gene structure and raw ExdWT IP signal of the highlighted area on the Hi-C maps (yellow box) is shown below.

